

XRP price eyes crash to $1 as funding rate turns negative, liquidations jump
Ripple’s XRP price token crashed to its lowest level since October last year, and technicals and the futures market points to more downside, possibly to the key support level at $1 in the near term.
- XRP price continued its strong downward trend in the past few months.
- The futures funding rate has turned negative and reached its lowest level in weeks.
- Technical analysis suggests that the Ripple token has more downside to go in the near term.
Ripple (XRP) token dropped to a low of $1.63, down by over 55% from its highest level in 2026. This retreat coincided with the broader retreat among Bitcoin and most altcoins.
Third-party data show that the weighted funding rate fell to its lowest level in weeks. Funding rate is an important metric in the perpetual futures market that measures the fee charged to traders holding long and short positions. A negative funding rate is a sign that shorts are paying longs, a sign that they expect the price to drop in the future.
Meanwhile, more long trader are being liquidated during the ongoing crash. Positions worth $57 million were liquidated on Sunday after $69 million was wiped out the day before.
Demand for XRP ETFs has also dropped in the past two weeks. These funds shed over $52 million in assets in a day, a week after shedding $40 million. As a result, the funds had a net inflow of over $15 million, the lowest monthly increase on record.
More data shows that the number of payments from one account to another dropped sharply on Monday. XRP Ledger transactions dropped to 1.03 million, down sharply from 1.88 million last week. The decline in transactions occurred as the number of active accounts fell to 11,000 from last week’s high of 21,000.
XRP price technical analysis
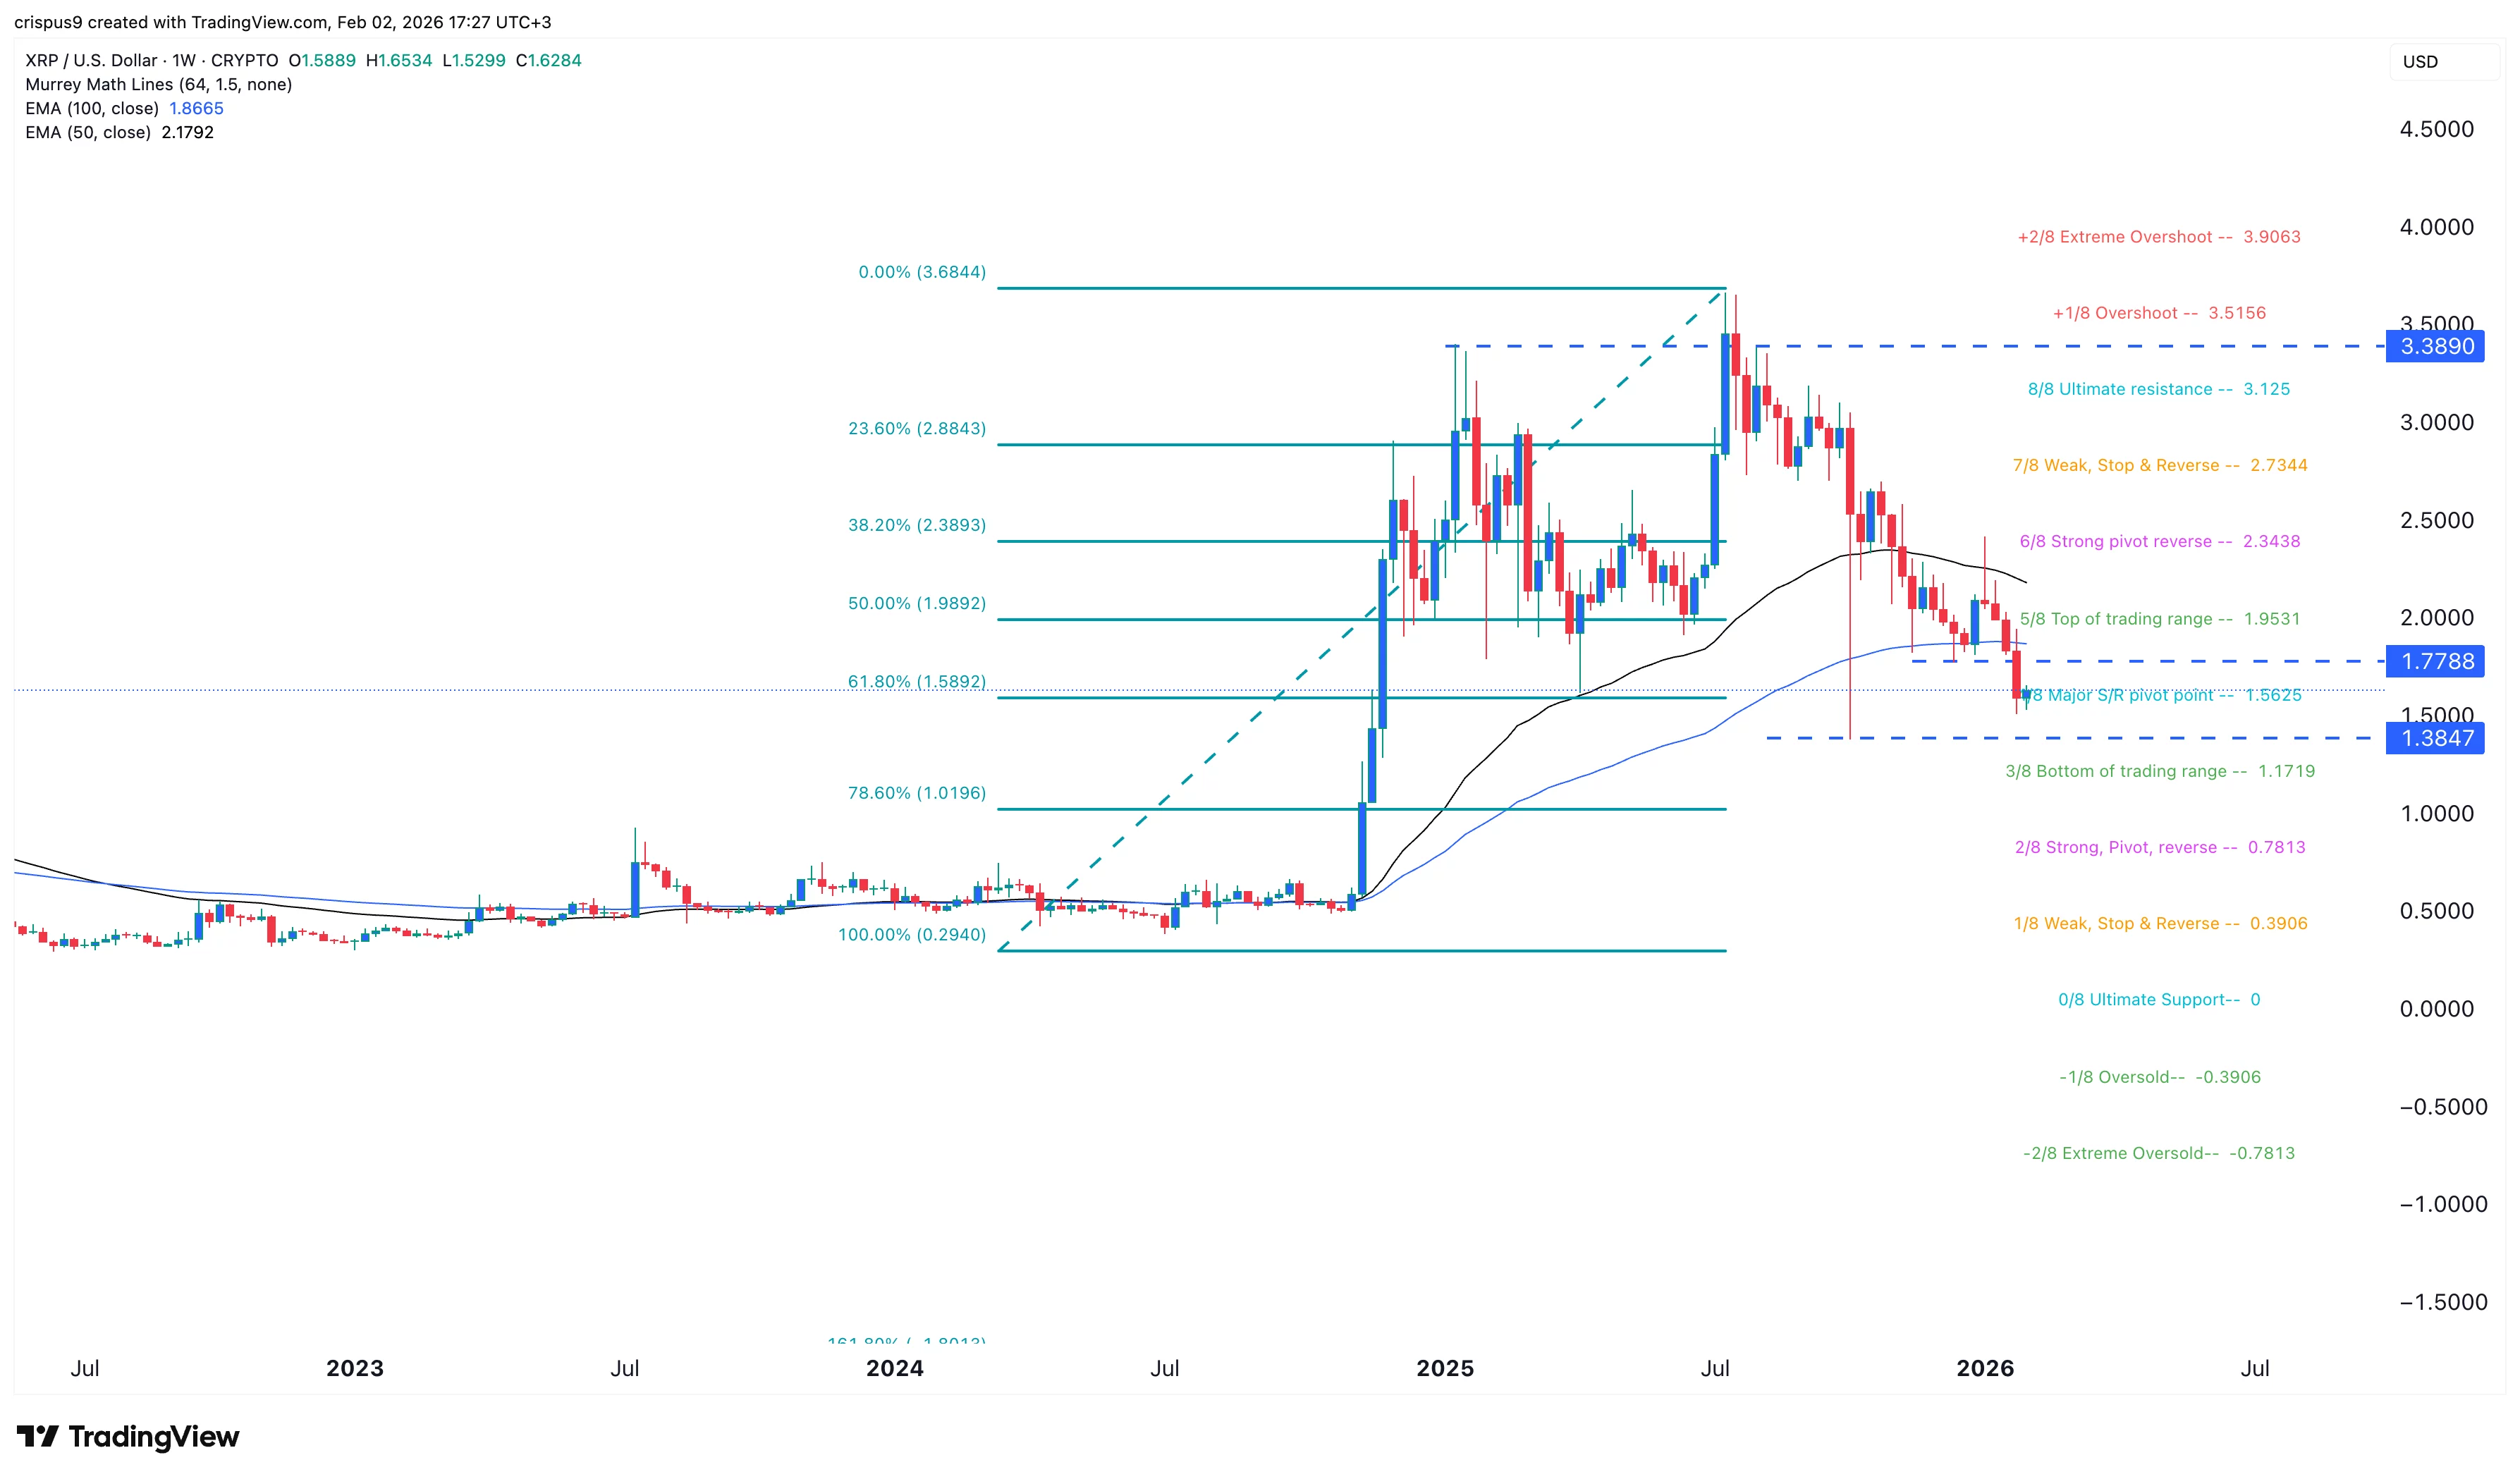
The weekly timeframe chart shows that the Ripple price has crashed in the past few months. It has tumbled from a high of $3.66 to a low of $1.600, its lowest level in months.
The coin has dropped to the Major S&R pivot point of the Murrey Math Line. It has moved below the 50-week and 100-week Exponential Moving Averages.
XRP price has moved to the 61.8% Fibonacci Retracement level, while the Relative Strength Index and the MACD have continued falling.
Therefore, the coin will likely continue falling as sellers target the key support level at $1, which would be a 38% drop from the current level.
On the flip side, a move above the $2 resistance level would invalidate the bearish XRP price forecast and signal further gains.
Ayrıca Şunları da Beğenebilirsiniz

Polymarket Temporarily Barred from Nevada as Legal Fight Escalates

The Revolutionary MacOS Launch That’s Transforming Agentic Coding Forever
