

Building a DEXScreener Clone: A Step-by-Step Guide
DEX Screener is primarily used by crypto traders who need access to on-chain data like trading volumes, liquidity, and token prices. This information allows them to analyze trends, monitor new listings, and make informed investment decisions.
In this tutorial, I will build a DEXScreener clone from scratch, covering everything from the initial design to a functional app with DEX Screener's core features. We will use Streamlit, a Python framework for building full-stack apps, and fetch real-time data using CoinGecko's On-Chain API free plan, which provides extensive data coverage for over 200 chains and 1,600+ DEXs.
Pre-Requisite
Before we start building the clone, please make sure you have
- Python 3.8+: Ensure it's installed (python.org).
- Basic Knowledge: Familiarity with APIs and DEXScreener.
With this, you will be able to build the clone easily.
Design Thinking
I will first plan out the app's structure for covering basic DEXScreener's functionality with minimal complexity.
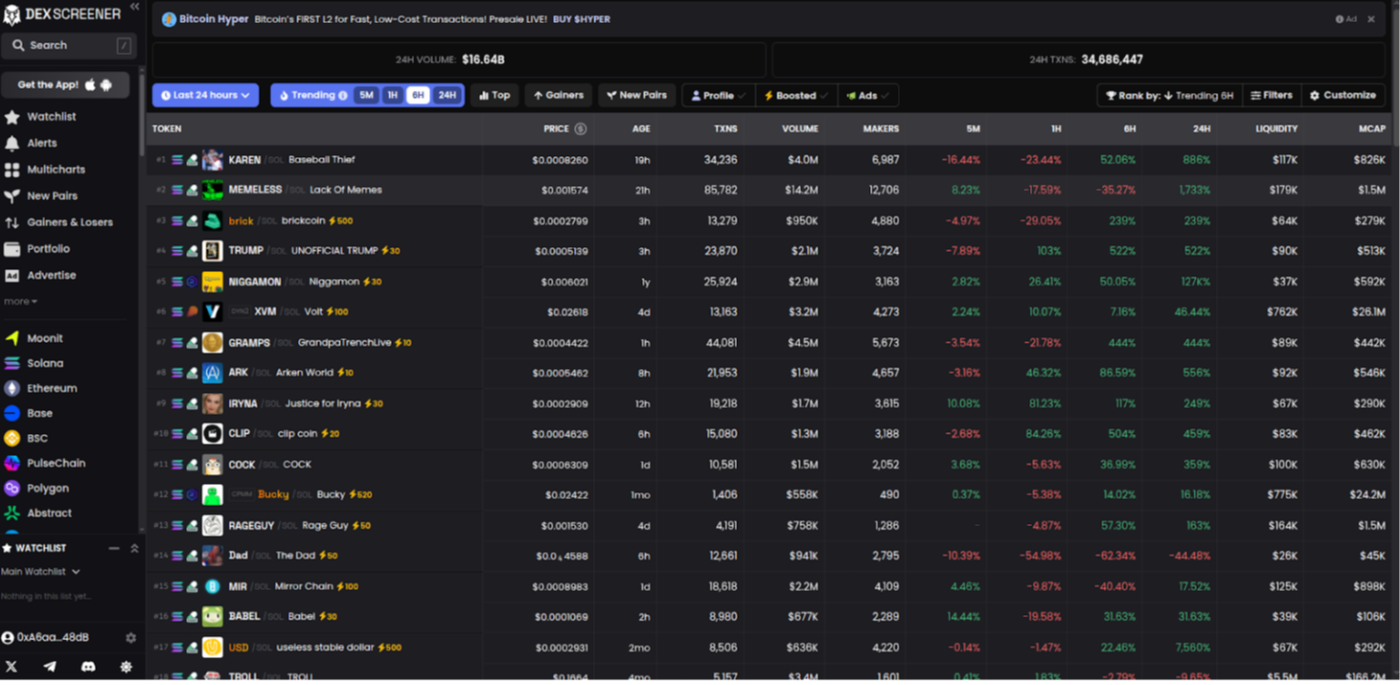
This is DEXScreener's Homepage, which shows the market activities.
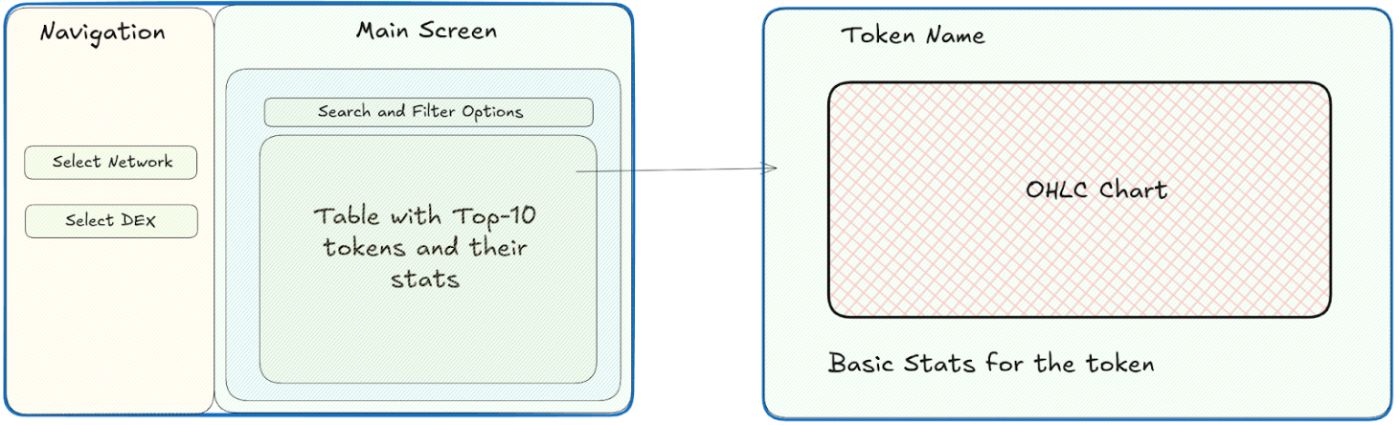
The core components of the application are
- Main Page: Displays trending and new liquidity pools in a table with key stats (token name, price, volume, liquidity).
- Sidebar Navigation and Filtering: A sidebar lists available chains and DEXs, allowing users to view the top pools for their selection. The main view will also include a simple form to filter these pools by volume and liquidity.
- Search: Allows users to find pools by name or contract address..
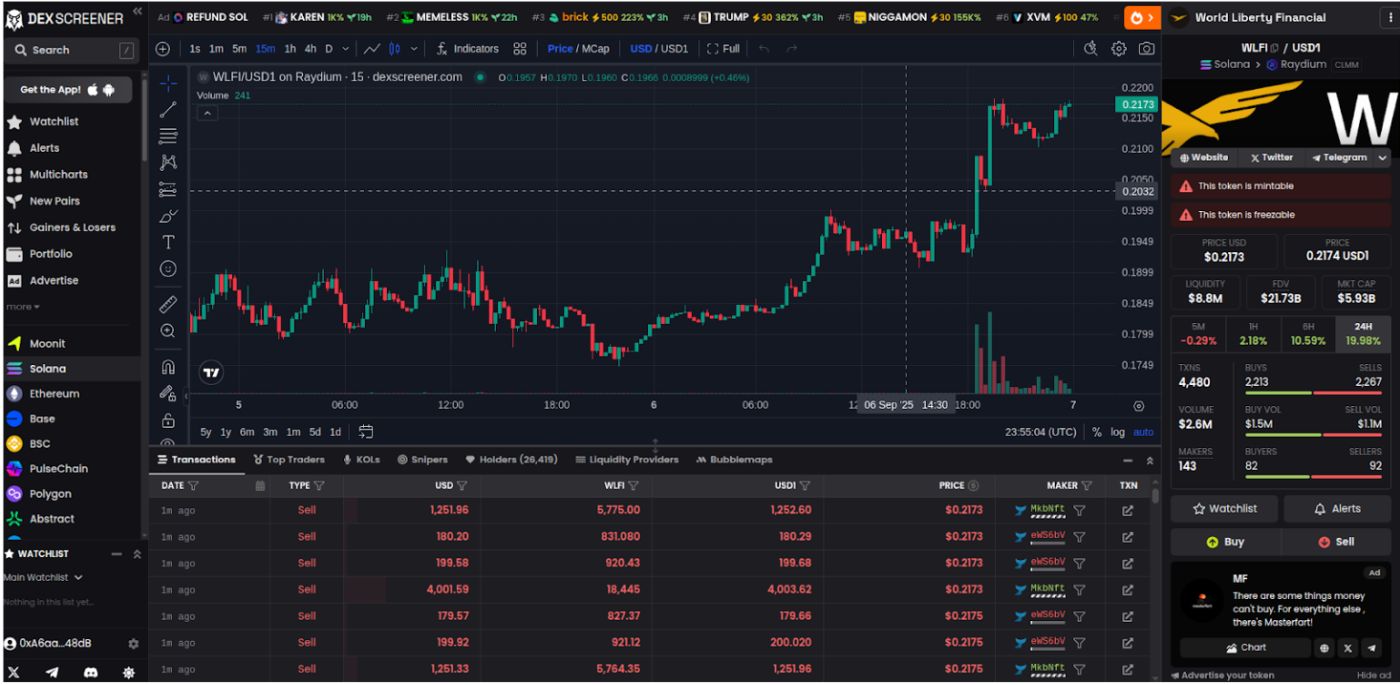
When clicking on any of the pools, users can view in-depth stats for a selected pool, including liquidity volume, price changes, and OHLCV charts.
\ Here's the design template for structuring the components on our clone application.
With this in place, the next step is to set up the project environment and prepare the basic version on which we can build.
Setup Instructions
I will be using the Pipenv python dependency manager for virtual environments. Install it globally
pip install pipenv
Now, please follow the steps for complete setup.
Step-1 : Set Up the Project Directory
Create a project folder and initialize the pipenv shell to manage dependencies in a virtual environment.
mkdir dexscreener-clone cd dexscreener-clone pipenv --python 3.8 # Use your Latest Python version after checking python --version Step-2: Signup for CoinGecko's API Keys
Signup at CoinGecko and generate an API key. After signing in, Navigate to the Developer Dashboard.
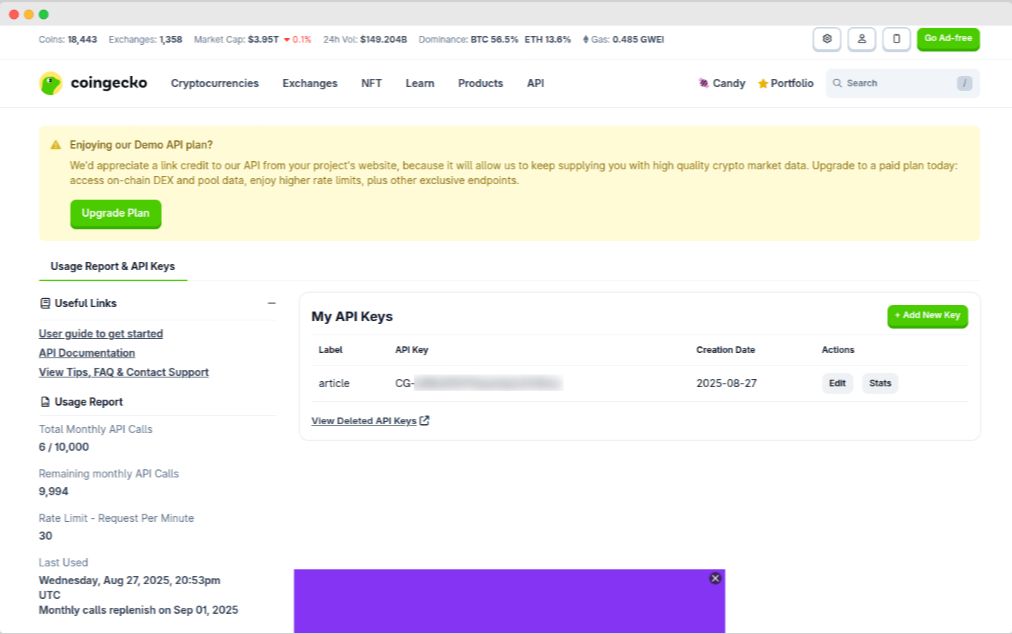
Click on +Add New Key and label your key (for example: testing, production, or tutorial). Copy the generated key and store it safely, as this is what you'll use in your code to authenticate API requests.
CoinGecko provides separate documentation for Demo and Paid APIs:
- Demo Plan API Documentation (free, limited usage): CoinGecko Demo API Docs
- Paid Plan API Documentation (higher limits, advanced features): CoinGecko Paid Plan API Docs
This tutorial is based on the Demo API, but the concepts remain the same for Paid plans. Only the base URL and usage limits differ.
All Demo API requests are routed through the following base URL:
https://api.coingecko.com/api/v3
Authentication is done by attaching your Demo API key in the request header. Specifically, you'll use the header field:
x-cg-demo-api-key: <YOUR-DEMO-API-KEY>
The easiest way to test your connection is by calling the /ping endpoint, which confirms that the API is responsive and your key is valid.
Here's an example for the Demo API ping:
curl --request GET --url https://api.coingecko.com/api/v3/ping --header 'accept: application/json' --header 'x-cg-demo-api-key: CG-your-api-key' Expected Response:
{ "gecko_says": "(V3) To the Moon!" } If you see this response, congratulations! You've successfully connected to the CoinGecko Demo API. From here, you can start exploring real data endpoints like market prices, token metadata, and liquidity pools.
Step-3: Install Dependencies
First of all, activate the virtual environment
pipenv shell
Now, install Streamlit and the required libraries using Pipenv. These include requests for API calls, pandas for data handling, plotly for charts, and python-dotenv for environment variables.
pipenv install streamlit requests pandas plotly python-dotenv
Store your API key securely in a .env file to prevent hardcoding.
echo "CG_DEMO_API_KEY=your_demo_api_key_here" > .env
Replace yourdemoapikeyhere with your CoinGecko API key. The .env file will be loaded by python-dotenv in your code.
Building the Application
Now that the setup is complete, let us build the core functionality of our DEXScreener clone. We will start by creating the main script file and implement the features step-by-step.
Create a new file dexscreener_clone.py
touch dexscreener_clone.py
Now, import the required libraries and environment secrets.
import os import requests import streamlit as st import pandas as pd import plotly.graph_objects as go from dotenv import load_dotenv load_dotenv() BASE_URL = "https://api.coingecko.com/api/v3/" API_KEY = os.getenv("CG_DEMO_API_KEY") # Use your key from .env This loads the environment variables and sets up the base URL for the API.
Now, we will write an API fetch helper function for calling CoinGecko's APIs with their endpoints and required parameters.
\
def fetch_api(endpoint, params=None): """Helper to fetch from CoinGecko API""" if params is None: params = {} params["x_cg_demo_api_key"] = API_KEY response = requests.get(f"{BASE_URL}/{endpoint}", params=params) if response.status_code != 200: st.error(f"API Error: {response.json().get('error', 'Unknown error')}") return None return response.json() This function handles API calls with error display in Streamlit.
Now, let us add the Navigation Sidebar on our application which will show all the available networks and the DEXs as given by CoinGecko API's data.
``` javascript ---------------- Sidebar Navigation ---------------- st.sidebar.title("Navigation")
networksdata = fetchapi("onchain/networks") selectednetwork = None selecteddex = None
if networksdata: networks = [n["id"] for n in networksdata["data"]] selected_network = st.sidebar.selectbox("Select Network", networks)
if selectednetwork dexesdata = fetchapi(f"onchain/networks/{selectednetwork}/dexes") if dexesdata: dexes = [d["id"] for d in dexesdata["data"]] selected_dex = st.sidebar.selectbox("Select DEX", dexes)
\ This code fetches the available networks and DEXs from the CoinGecko API using the *[/onchain/networks](https://docs.coingecko.com/v3.0.1/reference/networks-list)* and *[/onchain/networks/{selected_network}/dexes](https://docs.coingecko.com/v3.0.1/reference/dexes-list)* endpoints, respectively. The results are then used to populate the dropdown selection menus in the sidebar. Now run the Streamlit app using the following command to check what it looks like. `streamlit run dexscreener_clone.py` Open <http://localhost:8501> in your browser. It will look just like this. 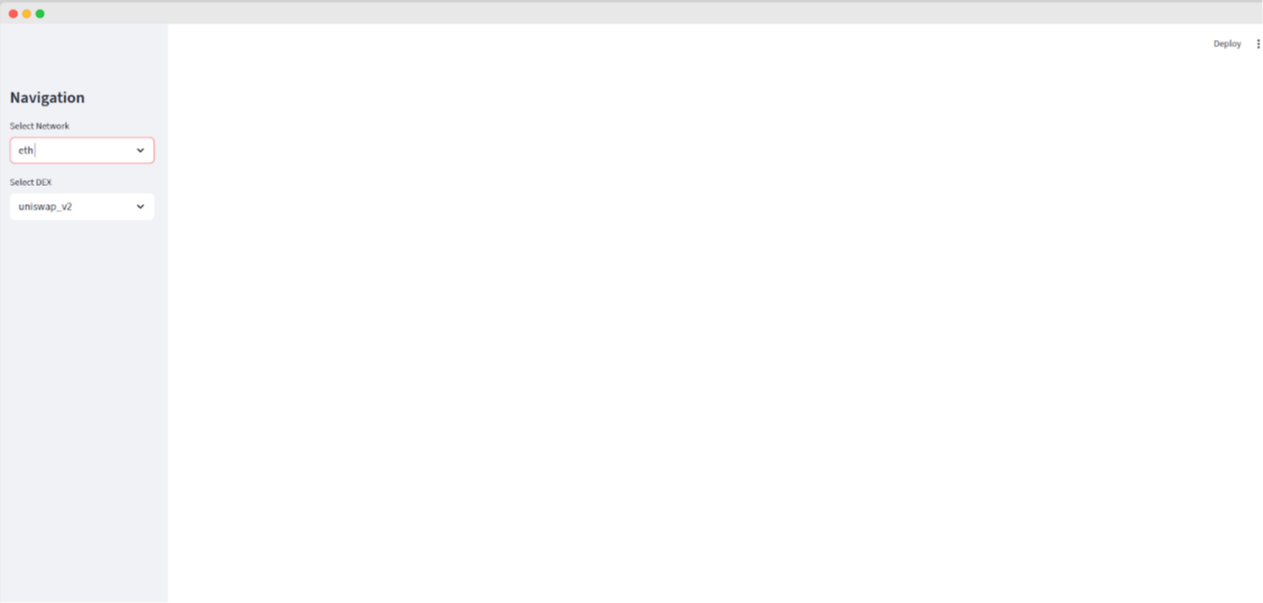 This fetches the networks and DEXs from the **Networks Endpoint**: *onchain/networks* **DEX Endpoint**: *onchain/networks/{selected_network}/dexes* endpoints and puts them as available options on the input dropdown. DEX Screener highlights **trending pools** across multiple chains to help traders quickly discover new opportunities. These pools are usually the ones with sudden spikes in activity or new token launches or rapid liquidity growth. To replicate this feature in our clone, I have used *[onchain/networks/trending_pools](https://docs.coingecko.com/v3.0.1/reference/trending-pools-list)* endpoint. It returns the most active and popular pools. javascript --------------- Trending Pools Section ---------------- st.subheader("🔥 Trending Pools Across Networks") trendingdata = fetchapi("onchain/networks/trending_pools")
if trendingdata: trendingpools = trendingdata.get("data", []) if trendingpools: trendingdf = pd.DataFrame([p["attributes"] for p in trendingpools])
# Normalize nested fields trending_df["volume_usd_24h"] = trendingdf["volumeusd"].apply( lambda x: x.get("h24") if isinstance(x, dict) else x ) trendingdf["liquidityusd"] = trendingdf["reservein_usd"].apply( lambda x: x.get("value") if isinstance(x, dict) else x )
trending_df["volume_usd_24h"] = pd.to_numeric(trending_df["volume_usd_24h"], errors="coerce").fillna(0) trending_df["liquidity_usd"] = pd.to_numeric(trending_df["liquidity_usd"], errors="coerce").fillna(0) st.dataframe( trending_df[["name", "base_token_price_usd", "liquidity_usd", "volume_usd_24h"]].head(10) ) else: st.info("No trending pools found at the moment.") else: st.warning("Could not fetch trending pools right now.")
Here is an example of how the data will be displayed in the frontend of our Streamlit app: 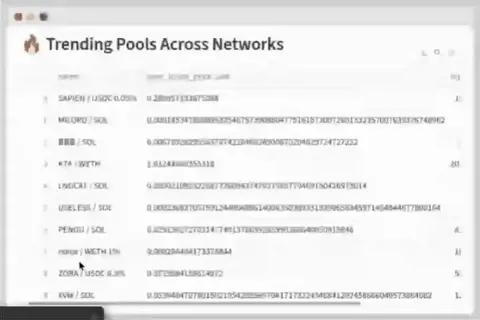 Now let us build a basic filtering option on a collapsible section. javascript
---------------- Main Screen ----------------
st.title("DEXScreener Clone")
with st.expander("Search & Filter Options"): minvolume = st.numberinput("Min 24h Volume (USD)", minvalue=0) minliquidity = st.numberinput("Min Liquidity (USD)", minvalue=0) apply_filters = st.button("Apply Filters")
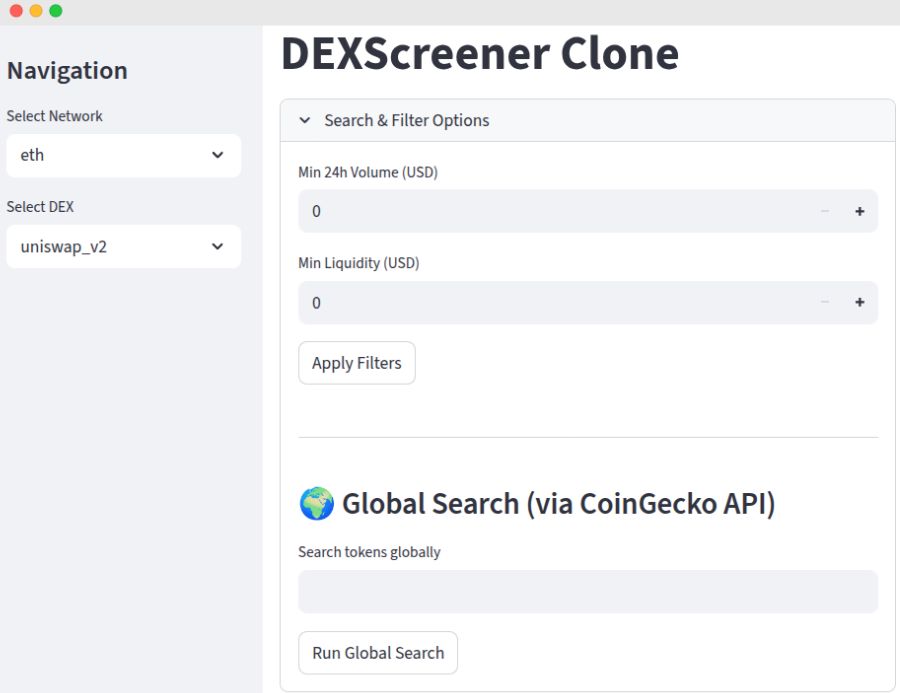 The *[onchain/search/pools](https://docs.coingecko.com/v3.0.1/reference/search-pools)* endpoint allows us to search globally for any token pool based on the token name or contract address. javascript ---------------- Global Search Results (Outside Expander) ----------------
javascript if runglobalsearch and globalsearchterm: searchresults = fetchapi("onchain/search/pools", params={"query": globalsearchterm})
if searchresults and "data" in searchresults: pools = searchresults["data"] if pools: # Extract pool info rows = [] for pool in pools: attr = pool["attributes"] rows.append({ "Pool Name": attr.get("name"), "Base Token Price (USD)": attr.get("basetokenpriceusd"), "Quote Token Price (USD)": attr.get("quotetokenpriceusd"), "Pool Address": attr.get("address"), "FDV (USD)": attr.get("fdvusd"), "Volume 24h (USD)": attr.get("volumeusd", {}).get("h24"), "Created At": attr.get("poolcreated_at") })
search_df = pd.DataFrame(rows) st.subheader("Global Search Results") st.dataframe(search_df) else: st.info("No pools found for that search term.") else: st.warning("Could not fetch search results right now.")
Now we can put a token of our choice in the search bar and we will get all the matching items as per that term. 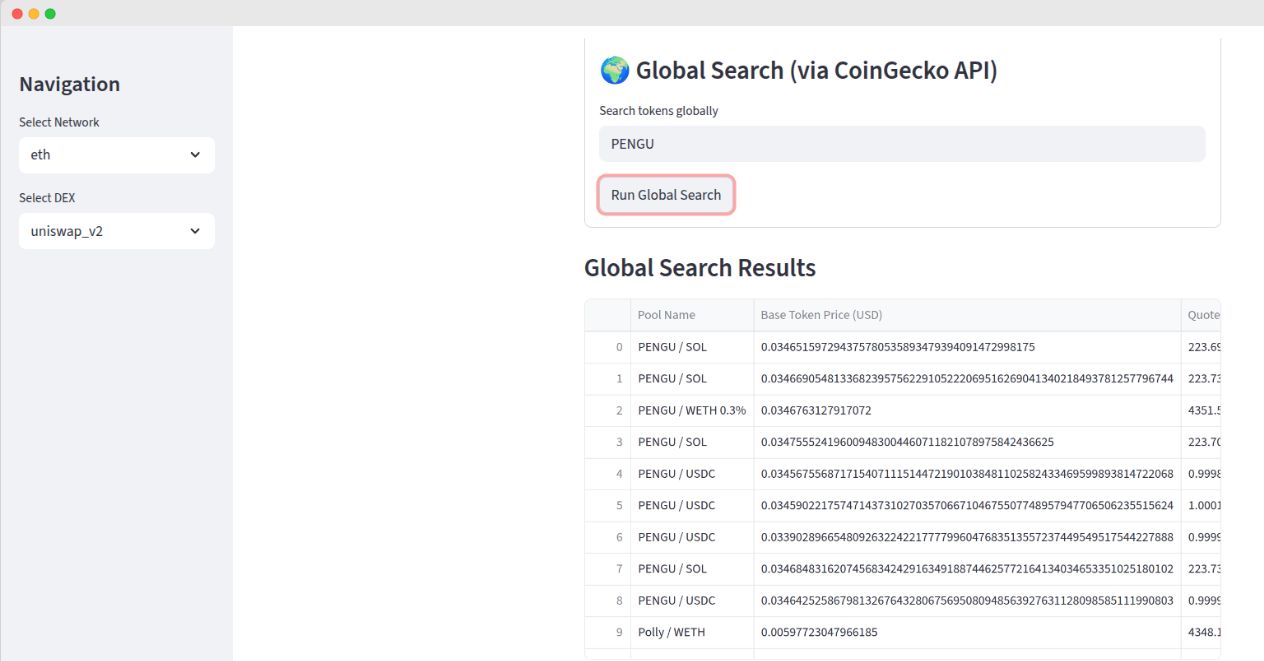 Now based on the selected network and DEX and also the filters we will display top pools. For that I will make a call to *[onchain/networks/{selected_network}/dexes/{selected_dex}/pools](https://docs.coingecko.com/v3.0.1/reference/top-pools-dex)* endpoint. javascript Show Top-10 Pools for selected network + DEX
javascript if selectednetwork and selecteddex: poolsdata = fetchapi(f"onchain/networks/{selectednetwork}/dexes/{selecteddex}/pools") if poolsdata: pools = poolsdata.get("data", []) df = pd.DataFrame([p["attributes"] for p in pools])
🔹 Flatten nested dict fields into numeric columns
if "volume_usd" in df.columns: df["volume_usd_24h"] = df["volume_usd"].apply( lambda x: x.get("h24") if isinstance(x, dict) else x ) else: df["volume_usd_24h"] = 0 if "reserve_in_usd" in df.columns: df["liquidity_usd"] = df["reserve_in_usd"].apply( lambda x: x.get("value") if isinstance(x, dict) else x ) else: df["liquidity_usd"] = 0 # ✅ Convert to numeric (fix TypeError issue) df["volume_usd_24h"] = pd.to_numeric(df["volume_usd_24h"], errors="coerce").fillna(0) df["liquidity_usd"] = pd.to_numeric(df["liquidity_usd"], errors="coerce").fillna(0) # Apply filters if set if apply_filters: df = df[ (df["volume_usd_24h"] >= min_volume) & (df["liquidity_usd"] >= min_liquidity) ] st.subheader("Top-10 Tokens & Stats") top_df = df[["name", "base_token_price_usd", "liquidity_usd", "volume_usd_24h"]].head(10) st.dataframe(top_df) *The JSON response includes attributes like* `name`*,* `base_token_price_usd`*, and* `volume_usd` *across multiple timeframes (h1, h6, h24). For this clone, I will display the 24-hour volume (*`h24`*) and the total locked liquidity, which is available under the* `reserve_in_usd` *parameter.* 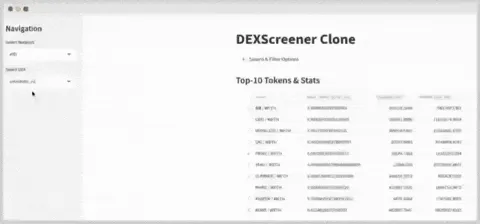 This fetches and displays top 10 pools from the selected DEX, additionally applying manual filters on the DataFrame. Now, I will build the most interesting part of the application, which is when you select any token, you should be able to see the OHLCV graphs and the token details. OHLCV stands for Open (starting price in a period), High (peak price), Low (bottom price), Close (ending price), and Volume (trading amount). # Select token token_choice = st.selectbox("Select a token to view details", top_df["name"]) token_row = df[df["name"] == token_choice].iloc[0] # ---------------- Token Detail View ---------------- # st.header(token_choice) pool_address = token_row["address"] # Fetch OHLCV Data ohlcv_data = fetch_api( f"onchain/networks/{selected_network}/pools/{pool_address}/ohlcv/day" ) if ohlcv_data: ohlcv = ohlcv_data["data"]["attributes"]["ohlcv_list"] # Fix: include 6 columns (timestamp, open, high, low, close, volume) ohlcv_df = pd.DataFrame( ohlcv, columns=["timestamp", "open", "high", "low", "close", "volume"] ) ohlcv_df["date"] = pd.to_datetime(ohlcv_df["timestamp"], unit="s") # Candlestick + Volume subplot fig = go.Figure() # Price candles fig.add_trace(go.Candlestick( x=ohlcv_df["date"], open=ohlcv_df["open"], high=ohlcv_df["high"], low=ohlcv_df["low"], close=ohlcv_df["close"], name="Price" )) # Volume bars fig.add_trace(go.Bar( x=ohlcv_df["date"], y=ohlcv_df["volume"], name="Volume", marker_color="lightblue", opacity=0.5, yaxis="y2" )) # Layout with dual y-axis fig.update_layout( title=f"{token_choice} - OHLCV Chart", xaxis=dict(title="Date", rangeslider=dict(visible=False)), yaxis=dict(title="Price (USD)"), yaxis2=dict( title="Volume", overlaying="y", side="right", showgrid=False ), legend=dict(orienta ```
We can select the token and fetch the OHLCV data and display the candlestick chart with volume overlay and basic statistics about that coin.
The onchain/networks/{selectednetwork}/pools/{pooladdress}/ohlcv/{period} endpoint gives the historical price action data. The {period} parameter lets you choose "minute", "hour", "day", etc. I am using "day" for daily summaries, but you could swap to "hour" for finer detail (finer periods mean more data points, so watch your API calls).
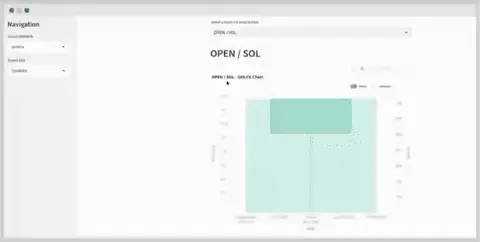
With this implementation, your clone is ready to run. Test it by selecting Ethereum and Uniswap V3, applying a $10,000 min volume filter, picking a pool like ETH/USDC, and watching the chart come alive.
API Optimization and Performance
CoinGecko's Demo API enforces strict limits of 30 calls per minute and 10,000 calls per month. Thus, we would need to stay below the threshold for the project.
One way to do this is cache the response for calls that won't change every time. For example, Network lists and the DEX information rarely changes and we can cache it for hours, while token prices and volume data should be cached for short periods like 5-10 minutes for reasonable accuracy.
For improving the performance, there could be pagination where we only fetch a subset of results which will be displayed. Large datasets can quickly degrade the browser performance.
Wrap-Up
The entire DEXScreener clone was built with just a concise set of Python code that delivers core features like on-chain pool data, filtering, and interactive candlestick charts. In under 200 lines it provides crypto traders with valuable insights into decentralized exchange activity.
The CoinGecko On-Chain API makes building applications like this straightforward. Endpoints like /onchain/networks and /onchain/pools/ohlcv/{period} deliver structured JSON data, providing easy access to network lists, pool statistics, and historical price data with minimal configuration.
While this guide covers the basics, the CoinGecko API provides all the necessary endpoints to build a fully-featured DEXScreener clone. For example, you could enhance your app by:
- Getting token metadata like logos via the /onchain/networks/{network}/tokens/{address}/info endpoint.
- Displaying top token holders and recent trades using the /onchain/networks/{network}/tokens/{address}/topholders and /onchain/networks/{network}/tokens/{tokenaddress}/trades endpoints.
These additional data points are highly valuable for traders and analysts exploring on-chain activity.
Streamlit also made the development process a lot smoother so I was able to create a responsive web interface using pure Python. This approach makes sure that backend engineers can focus on functionality while Streamlit handles the presentation layer effortlessly.
Here's the full working code you can use and run directly on your system.
The DEXScreener clone is now ready for use. You can deploy it on Streamlit Community Cloud, enhance it and continue exploring these tools to unlock even more possibilities for building your next Web3 application.
Ayrıca Şunları da Beğenebilirsiniz

Moonshot MAGAX vs Shiba Inu: The AI-Powered Meme-to-Earn Revolution Challenging a Meme Coin Giant

‘Alien Earth’ Composer Jeff Russo Dives Into Score For FX Series
