

What do they Know? 140,000,000 XRP Sold by Ripple Whales
Ripple’s XRP is trading around $2.62 at the time of writing, after climbing from a seven-day low of $2.34. The token is up 8% over the past week, though over the past 24 hours it shows little change, according to CoinGecko.
Market data now suggests that large holders may be stepping back after the latest rally.
Large Holders Reduce Exposure
Wallets holding between 1 million and 10 million XRP have reportedly sold over 140 million tokens. This activity took place as prices climbed, raising questions about the sustainability of the move.
The decline in whale holdings was shared by analyst Ali Martinez, who noted a steady drop in large wallet balances as XRP pushed higher. This shift in positioning has raised concerns, as similar patterns have occurred before price reversals. The post read,
Moreover, the TD Sequential indicator has flashed a sell signal on XRP’s daily chart, as reported by CryptoPotato. Several short-term reversals have followed this tool in the past few months. While this signal doesn’t confirm a reversal by itself, its past performance suggests it could be a warning for bulls.
XRP Near Resistance, Momentum Weakens
XRP is now testing the upper Bollinger Band near $2.69. The price has moved off the lower band earlier this month and is approaching a zone where previous moves have paused or reversed. The bands remain tight, suggesting a lack of strong volatility expansion.
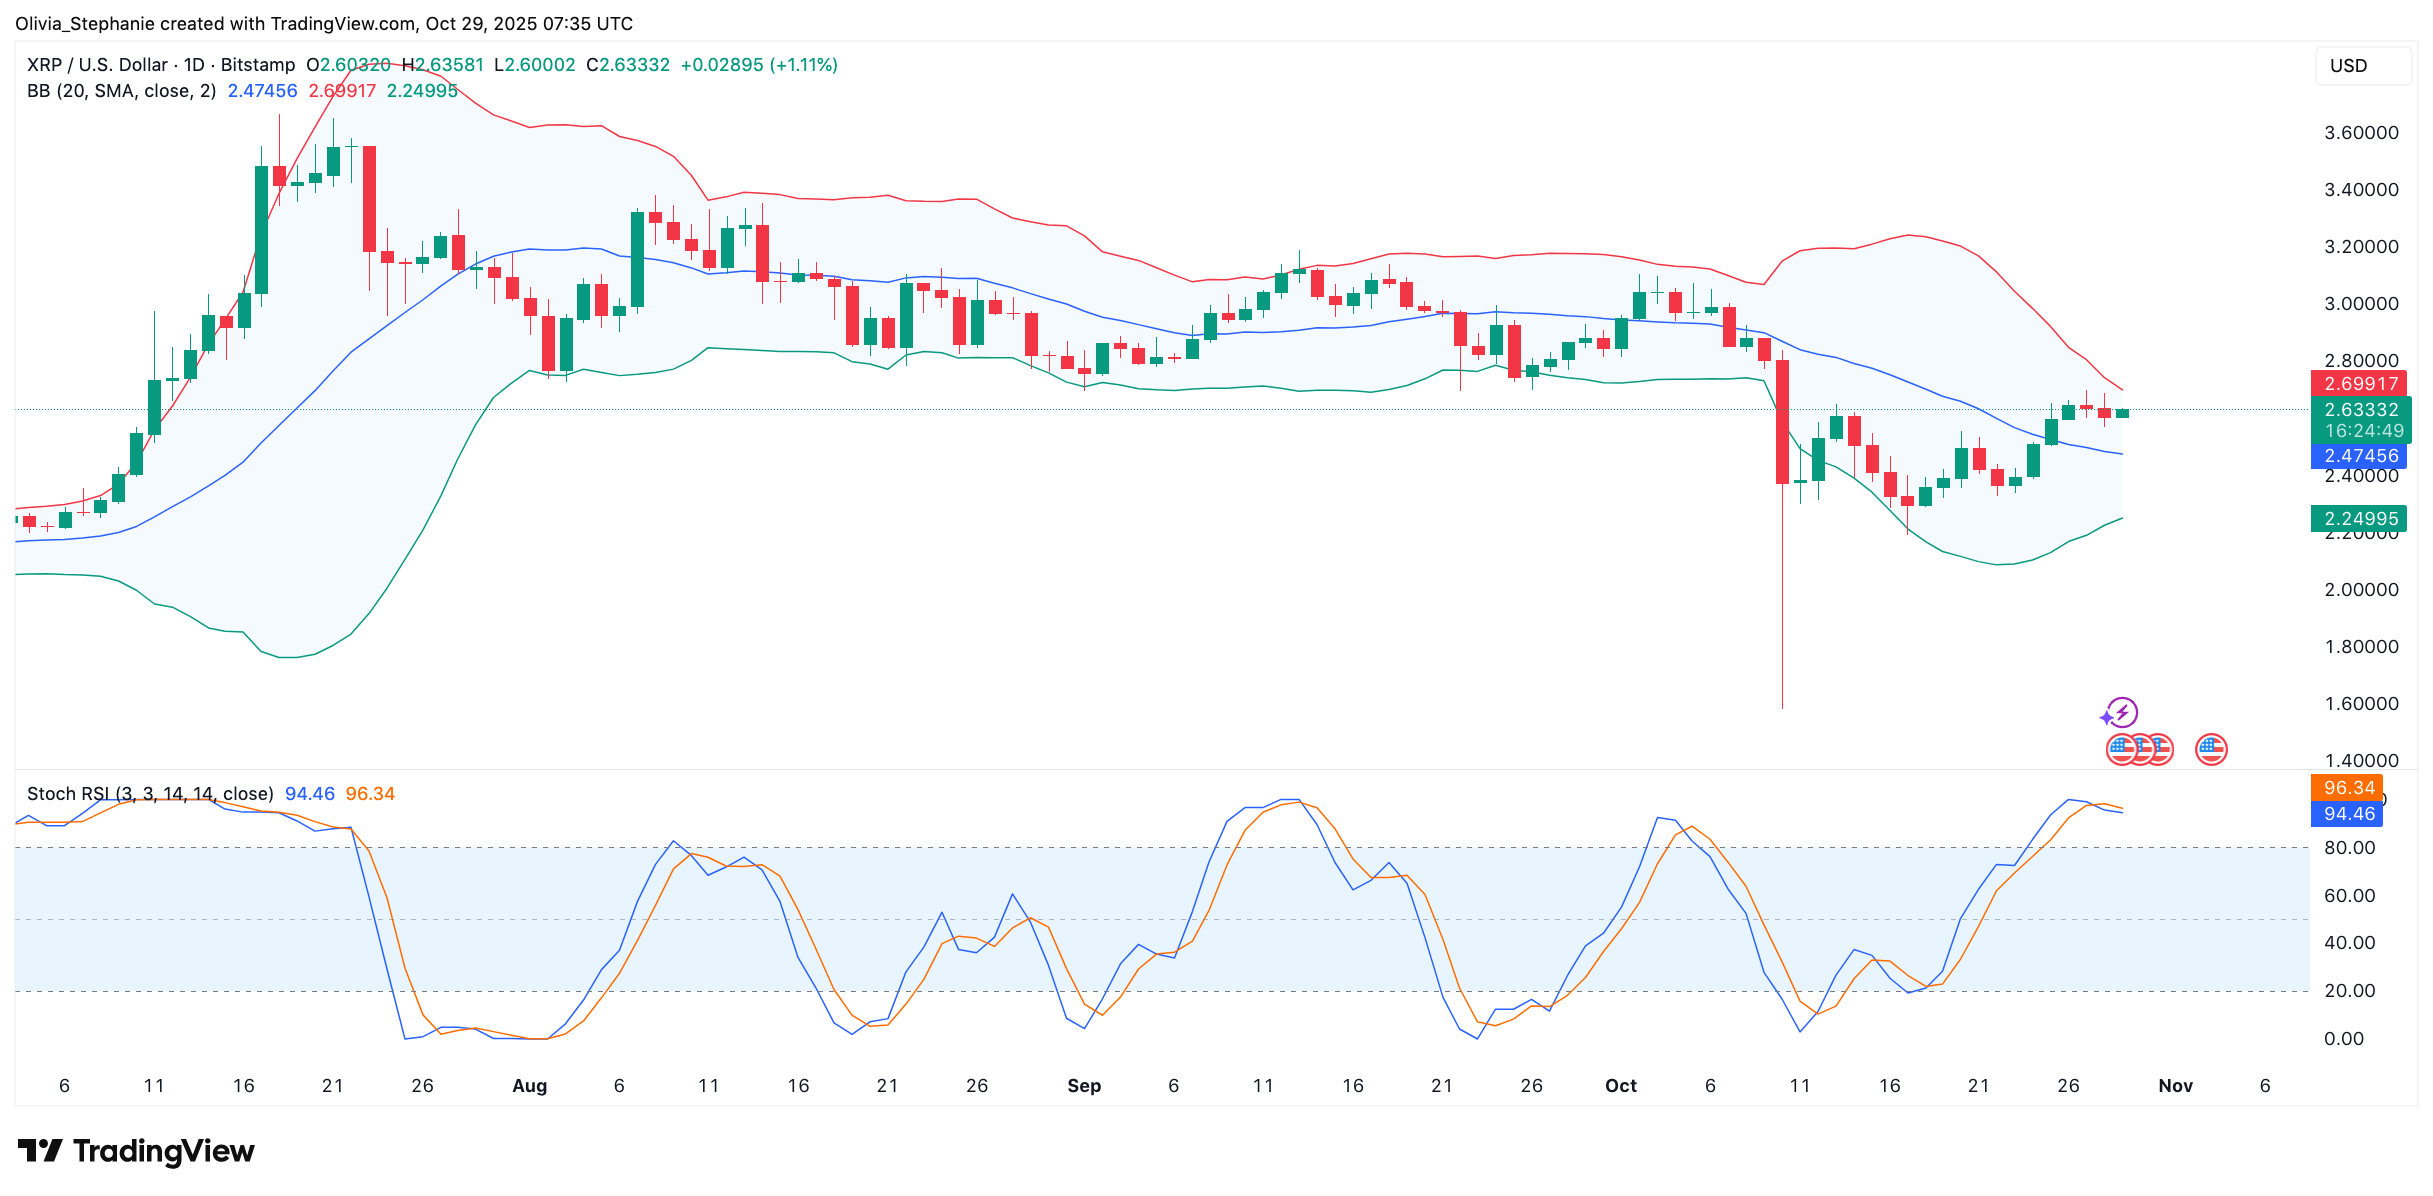 Source: TradingView
Meanwhile, the Stochastic RSI is showing overbought readings. Both %K and %D are above 94, and a bearish crossover is forming. This setup has often marked short-term turning points in recent charts.
Key Levels Still in Play
Analyst Man of Bitcoin has marked $2.53 as a level to watch. A break below this area may indicate that a larger corrective move is forming.
As recently reported by CryptoPotato, XRP is still tracking within a possible Wave 4 structure. The analysis noted that unless $2.82 is cleared, there may still be one more move down before a broader breakout attempt.
The post What do they Know? 140,000,000 XRP Sold by Ripple Whales appeared first on CryptoPotato.
You May Also Like

Why Is Pi Network Token (PI) Up 22% on Oct. 29?

German VDMA cautions U.S. tariff expansion will impact over 50% of machine exports

BNB Price Drops 2% as the Dex Volume Tumbles Cautioning Further Downside
Highlights: The BNB price is down 2% to $1111.46, despite the trading volume spiking 26%. The BNB on-chain demand has slipped, with the open interest plummeting 3% showing a drop in demand. The technical outlook shows a tight tug-of-war, with the bulls attempting to overcome resistance zones. The BNB price is down 2% today, to trade at $1111.46. Despite the plunge, the daily trading volume has soared 26% showing increased market activity among traders. However, BNB Chain has seen declining network activity, with the open interest plummeting, signaling a drop in demand. On Chain Demand on BNB Cools Off The BNB Chain is in a state of cooldown of network activity, which indicates low on-chain demand. In most instances, when a network fails to ensure large volumes or revenues, it means that there is low demand or outflows to other networks. BNB DeFi Data: DeFiLlama According to DeFiLlama data, the volume of the Decentralized Exchanges (DEXs) is down to at least $2.12 billion in comparison to the high of $6.313 billion on October 8, which also means low on-chain liquidity. On the other hand, Coinglass data shows that the volume of BNB has grown by 3.97% to reach $4.95 billion. However, the open interest in BNB futures has dropped by 3.36% to reach $1.74 billion. This reduction in open interest is an indication of a conservative stance by investors since the number of new positions being opened is low. This could be an indication that investors are not so sure about the short-term price outlook. BNB Derivatives Data: CoinGlass Meanwhile, the long-to-short ratio is sitting at 0.9091. This shows that the traders are undecided on BNB price’s next move, as it sits below 1. BNB Price Moves Into Consolidation The chart displays the BNB/USD price action on a 4-hour timeframe, with the token currently hovering around $1111.46. The 50-day Simple Moving Average (SMA) is at $1113, while the 200-day SMA sits at $1129, cushioning the bulls against upside movement. The price has mostly been trending below both SMAs, indicating that the bears are having the upper hand. The BNB trading volume is up, soaring 26%, signaling the momentum is real. On the 4-hour chart, BNB is trading within a consolidation channel. In such a case, this pattern may act as an accumulation period, giving the bulls hind wings to break above resistance zones. BNB/USD 4-hour chart: TradingView Zooming in, the Relative Strength Index (RSI) sits at 44.15, below the 50 level. This shows weakening momentum in the BNB market, and might lead to the RSI plunging to the oversold region if the bulls don’t regain control. In the short term, the BNB price could move up to $1113 resistance and flip it into support. A close above this zone will see the bulls target $1126 resistance, giving the bulls strength to reclaim the $1230 mark. Conversely, if the resistance zones prove too strong, a dip towards $1012 could be plausible. In such a case, this could be a prime buy zone for the risk-takers. In the long term, if the token keeps the hype alive, the bulls may reclaim the $1375 high or higher. eToro Platform Best Crypto Exchange Over 90 top cryptos to trade Regulated by top-tier entities User-friendly trading app 30+ million users 9.9 Visit eToro eToro is a multi-asset investment platform. The value of your investments may go up or down. Your capital is at risk. Don’t invest unless you’re prepared to lose all the money you invest. This is a high-risk investment, and you should not expect to be protected if something goes wrong.