Author: 0xBrooker The progress of the US-China tariff conflict remains the biggest variable affecting major global financial markets. Although there has been some easing of tensions between the two sides this week, whether there will be real progress still depends on the upcoming negotiations between the two delegations. The key mid-term node is whether the leaders of the two countries can meet as scheduled during the APEC in South Korea. The Federal Reserve's continued dovish stance, coupled with the sluggish US job market, has led to market expectations for two 50 basis point rate cuts this year, providing underlying support for risky assets. Beyond the US-China tariff conflict and the Fed's dovish stance, BTC remains plagued by internal market structural issues. On one hand, over $20 billion in notional value has been wiped out from the futures market, making it difficult to gather momentum in the short term. Furthermore, the continued selling of long-term investors, driven by the cyclical nature of the market and facing insufficient capital, has made it difficult for the market to stabilize and rebound. Comparison of BTC Trends over the Past Cycles Another key point worth paying attention to is that US AI and technology stocks will enter the Q3 earnings reporting period starting next week. Whether their performance meets expectations will also have a significant impact on the financial market. Policy, macro-financial and economic data The main factor influencing the US stock market recently has been the various rhetoric surrounding the US-China trade war. Following last week's heavy-handed attempts at mutual restraint, both sides have released somewhat conciliatory rhetoric this week to soothe market sentiment. The US, in particular, has been circulated by President Trump and the Treasury Secretary, offering conciliatory rhetoric on various occasions, stating that high tariffs are unsustainable, that US-China relations remain strong, and that the US is unwilling to decouple from China economically, a sentiment shared by China. In contrast, China's response has been more measured, attributing the "global panic" to US rhetoric and actions toward China and emphasizing that export controls are driven by national security and industrial policy needs. According to media reports, the two delegations are about to engage in another round of contacts and negotiations. South Korea has confirmed that the US president will visit South Korea during APEC at the end of the month. Of course, whether the US and Chinese leaders can meet as scheduled during this period depends on whether the upcoming round of negotiations between the two delegations can achieve progress. Due to the easing of the tariff war, US stocks, which were experiencing a data-free period, temporarily stabilized, with the Nasdaq rising 2.14% for the week. The US dollar index, which had been approaching 100, fell 0.3% to close at 98.547. However, risk appetite has yet to fully improve, and the influx of funds pushed the 10-year US Treasury yield down 2.53% for the week, closing at 4.015%. Gold, however, experienced a fear-mongering (FOMO) rally, surging 5.76% for the week. Due to the US government shutdown, the release of several economic and employment data has been delayed. Federal Reserve Chairman Powell emphasized at the Philadelphia meeting that "the risk of weakening employment is of greater concern" and mentioned the possibility of a conditional end to balance sheet reduction. The overall tone is cautiously dovish, leaving room for further interest rate cuts. FedWatch is already fully pricing in a 50 basis point rate cut in October and December of this year. In the US stock market, major banks reported earnings exceeding expectations, but two regional banks were reported to have over $50 million in bad debts, sparking a period of market panic. Next week, AI and tech stocks, which are key market drivers, will begin their Q3 earnings season. While earnings exceeding expectations may provide some support for the volatile market, those falling short of expectations are likely to drive a downward correction. Crypto Market In last week's weekly report, we mentioned that the Bitcoin and crypto markets are currently under the dual influence of the US-China tariff war and the cyclical curse. This combination of factors has prevented Bitcoin from recovering from last week's losses along with the Nasdaq, instead continuing its downward trend. On top of last week's 6.84% drop, it has fallen another 5.55% this week. BTC daily trend Technically, BTC prices have fallen into the "Trump bottom" range ($90,000-110,000), a range that has held resistance and support for nearly a year since Trump's election in 2024. Furthermore, BTC has also briefly fallen below its 200-day moving average of $107,500, placing it technically on the line separating bull and bear markets. While BTC prices have fallen below their 200-day moving average several times during this bull market, perhaps this time is different? According to BTC's cyclical patterns, BTC has already entered its peaking phase. It's noteworthy that long-term investors, most influenced by the cyclical patterns, are accelerating their sell-offs, making it difficult for capital inflows into the weakening market to bear the brunt of the pressure. According to eMerge Engine statistics, the scale of selling by long- and short-term groups this week was 149,496 coins, which was lower than last week. Among them, the long-term group sold 19,978 coins, which was significantly higher than last week. Statistics on long-term selling and changes in the inventory of centralized exchanges (weekly) Long-term investors are believers in traditional BTC cycles. Their selling has a profound impact on the market and has been the most important force shaping previous cycle tops. Their continued selling may be due to the "curse" of the cycle. Breaking the old cycle and forming a new one will require the action of greater structural forces (such as DATs and BTC Spot ETF channel funds). Capital inflows declined again this week, following last week's decline. The BTC Spot ETF saw nearly $1.2 billion in outflows. Short-term capital outflows from ETFs due to the US-China tariff war were another major factor contributing to the rapid and sustained decline in BTC prices, in addition to long-term selling. Crypto Market Capital Flow Statistics (Weekly) Furthermore, the contract market's open interest continued to decline this week after a sharp drop last week, with fees briefly falling into negative territory. This suggests that long positions in the contract market are struggling to rally in the short term after the massive sell-off. Judging from technical analysis, long-term selling, capital inflows and outflows, and futures market structure, BTC prices are currently under significant pressure. Unless the US-China tariff war significantly improves and revitalizes market sentiment, a short-term or medium-term reversal is unlikely. Combined with the influence of the cyclical law, we believe long-term investors should position themselves for the end of the cycle. As stated in the September monthly report, the end of the old cycle and the beginning of a new one is a probabilistic event, not impossible, but it is now considered a high-probability event. Cycle indicators According to eMerge Engine, the EMC BTC Cycle Metrics indicator is 0, indicating that it is in the transition period.Author: 0xBrooker The progress of the US-China tariff conflict remains the biggest variable affecting major global financial markets. Although there has been some easing of tensions between the two sides this week, whether there will be real progress still depends on the upcoming negotiations between the two delegations. The key mid-term node is whether the leaders of the two countries can meet as scheduled during the APEC in South Korea. The Federal Reserve's continued dovish stance, coupled with the sluggish US job market, has led to market expectations for two 50 basis point rate cuts this year, providing underlying support for risky assets. Beyond the US-China tariff conflict and the Fed's dovish stance, BTC remains plagued by internal market structural issues. On one hand, over $20 billion in notional value has been wiped out from the futures market, making it difficult to gather momentum in the short term. Furthermore, the continued selling of long-term investors, driven by the cyclical nature of the market and facing insufficient capital, has made it difficult for the market to stabilize and rebound. Comparison of BTC Trends over the Past Cycles Another key point worth paying attention to is that US AI and technology stocks will enter the Q3 earnings reporting period starting next week. Whether their performance meets expectations will also have a significant impact on the financial market. Policy, macro-financial and economic data The main factor influencing the US stock market recently has been the various rhetoric surrounding the US-China trade war. Following last week's heavy-handed attempts at mutual restraint, both sides have released somewhat conciliatory rhetoric this week to soothe market sentiment. The US, in particular, has been circulated by President Trump and the Treasury Secretary, offering conciliatory rhetoric on various occasions, stating that high tariffs are unsustainable, that US-China relations remain strong, and that the US is unwilling to decouple from China economically, a sentiment shared by China. In contrast, China's response has been more measured, attributing the "global panic" to US rhetoric and actions toward China and emphasizing that export controls are driven by national security and industrial policy needs. According to media reports, the two delegations are about to engage in another round of contacts and negotiations. South Korea has confirmed that the US president will visit South Korea during APEC at the end of the month. Of course, whether the US and Chinese leaders can meet as scheduled during this period depends on whether the upcoming round of negotiations between the two delegations can achieve progress. Due to the easing of the tariff war, US stocks, which were experiencing a data-free period, temporarily stabilized, with the Nasdaq rising 2.14% for the week. The US dollar index, which had been approaching 100, fell 0.3% to close at 98.547. However, risk appetite has yet to fully improve, and the influx of funds pushed the 10-year US Treasury yield down 2.53% for the week, closing at 4.015%. Gold, however, experienced a fear-mongering (FOMO) rally, surging 5.76% for the week. Due to the US government shutdown, the release of several economic and employment data has been delayed. Federal Reserve Chairman Powell emphasized at the Philadelphia meeting that "the risk of weakening employment is of greater concern" and mentioned the possibility of a conditional end to balance sheet reduction. The overall tone is cautiously dovish, leaving room for further interest rate cuts. FedWatch is already fully pricing in a 50 basis point rate cut in October and December of this year. In the US stock market, major banks reported earnings exceeding expectations, but two regional banks were reported to have over $50 million in bad debts, sparking a period of market panic. Next week, AI and tech stocks, which are key market drivers, will begin their Q3 earnings season. While earnings exceeding expectations may provide some support for the volatile market, those falling short of expectations are likely to drive a downward correction. Crypto Market In last week's weekly report, we mentioned that the Bitcoin and crypto markets are currently under the dual influence of the US-China tariff war and the cyclical curse. This combination of factors has prevented Bitcoin from recovering from last week's losses along with the Nasdaq, instead continuing its downward trend. On top of last week's 6.84% drop, it has fallen another 5.55% this week. BTC daily trend Technically, BTC prices have fallen into the "Trump bottom" range ($90,000-110,000), a range that has held resistance and support for nearly a year since Trump's election in 2024. Furthermore, BTC has also briefly fallen below its 200-day moving average of $107,500, placing it technically on the line separating bull and bear markets. While BTC prices have fallen below their 200-day moving average several times during this bull market, perhaps this time is different? According to BTC's cyclical patterns, BTC has already entered its peaking phase. It's noteworthy that long-term investors, most influenced by the cyclical patterns, are accelerating their sell-offs, making it difficult for capital inflows into the weakening market to bear the brunt of the pressure. According to eMerge Engine statistics, the scale of selling by long- and short-term groups this week was 149,496 coins, which was lower than last week. Among them, the long-term group sold 19,978 coins, which was significantly higher than last week. Statistics on long-term selling and changes in the inventory of centralized exchanges (weekly) Long-term investors are believers in traditional BTC cycles. Their selling has a profound impact on the market and has been the most important force shaping previous cycle tops. Their continued selling may be due to the "curse" of the cycle. Breaking the old cycle and forming a new one will require the action of greater structural forces (such as DATs and BTC Spot ETF channel funds). Capital inflows declined again this week, following last week's decline. The BTC Spot ETF saw nearly $1.2 billion in outflows. Short-term capital outflows from ETFs due to the US-China tariff war were another major factor contributing to the rapid and sustained decline in BTC prices, in addition to long-term selling. Crypto Market Capital Flow Statistics (Weekly) Furthermore, the contract market's open interest continued to decline this week after a sharp drop last week, with fees briefly falling into negative territory. This suggests that long positions in the contract market are struggling to rally in the short term after the massive sell-off. Judging from technical analysis, long-term selling, capital inflows and outflows, and futures market structure, BTC prices are currently under significant pressure. Unless the US-China tariff war significantly improves and revitalizes market sentiment, a short-term or medium-term reversal is unlikely. Combined with the influence of the cyclical law, we believe long-term investors should position themselves for the end of the cycle. As stated in the September monthly report, the end of the old cycle and the beginning of a new one is a probabilistic event, not impossible, but it is now considered a high-probability event. Cycle indicators According to eMerge Engine, the EMC BTC Cycle Metrics indicator is 0, indicating that it is in the transition period.

Crypto Market Weekly Review (October 13th - 19th): How to cope with the BTC cycle under the heavy pressure of the cyclical law "curse"?

2025/10/20 16:00

Author: 0xBrooker

The progress of the US-China tariff conflict remains the biggest variable affecting major global financial markets. Although there has been some easing of tensions between the two sides this week, whether there will be real progress still depends on the upcoming negotiations between the two delegations. The key mid-term node is whether the leaders of the two countries can meet as scheduled during the APEC in South Korea.

The Federal Reserve's continued dovish stance, coupled with the sluggish US job market, has led to market expectations for two 50 basis point rate cuts this year, providing underlying support for risky assets.

Beyond the US-China tariff conflict and the Fed's dovish stance, BTC remains plagued by internal market structural issues. On one hand, over $20 billion in notional value has been wiped out from the futures market, making it difficult to gather momentum in the short term. Furthermore, the continued selling of long-term investors, driven by the cyclical nature of the market and facing insufficient capital, has made it difficult for the market to stabilize and rebound.
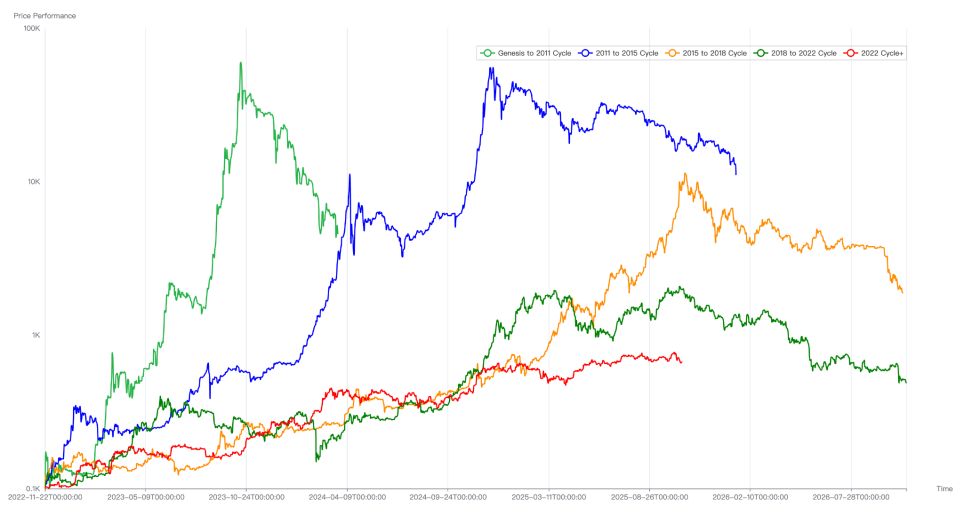
 Comparison of BTC Trends over the Past Cycles

Another key point worth paying attention to is that US AI and technology stocks will enter the Q3 earnings reporting period starting next week. Whether their performance meets expectations will also have a significant impact on the financial market.

Policy, macro-financial and economic data

The main factor influencing the US stock market recently has been the various rhetoric surrounding the US-China trade war. Following last week's heavy-handed attempts at mutual restraint, both sides have released somewhat conciliatory rhetoric this week to soothe market sentiment. The US, in particular, has been circulated by President Trump and the Treasury Secretary, offering conciliatory rhetoric on various occasions, stating that high tariffs are unsustainable, that US-China relations remain strong, and that the US is unwilling to decouple from China economically, a sentiment shared by China. In contrast, China's response has been more measured, attributing the "global panic" to US rhetoric and actions toward China and emphasizing that export controls are driven by national security and industrial policy needs.

According to media reports, the two delegations are about to engage in another round of contacts and negotiations. South Korea has confirmed that the US president will visit South Korea during APEC at the end of the month. Of course, whether the US and Chinese leaders can meet as scheduled during this period depends on whether the upcoming round of negotiations between the two delegations can achieve progress.

Due to the easing of the tariff war, US stocks, which were experiencing a data-free period, temporarily stabilized, with the Nasdaq rising 2.14% for the week. The US dollar index, which had been approaching 100, fell 0.3% to close at 98.547. However, risk appetite has yet to fully improve, and the influx of funds pushed the 10-year US Treasury yield down 2.53% for the week, closing at 4.015%. Gold, however, experienced a fear-mongering (FOMO) rally, surging 5.76% for the week.

Due to the US government shutdown, the release of several economic and employment data has been delayed. Federal Reserve Chairman Powell emphasized at the Philadelphia meeting that "the risk of weakening employment is of greater concern" and mentioned the possibility of a conditional end to balance sheet reduction. The overall tone is cautiously dovish, leaving room for further interest rate cuts. FedWatch is already fully pricing in a 50 basis point rate cut in October and December of this year.

In the US stock market, major banks reported earnings exceeding expectations, but two regional banks were reported to have over $50 million in bad debts, sparking a period of market panic. Next week, AI and tech stocks, which are key market drivers, will begin their Q3 earnings season. While earnings exceeding expectations may provide some support for the volatile market, those falling short of expectations are likely to drive a downward correction.

Crypto Market

In last week's weekly report, we mentioned that the Bitcoin and crypto markets are currently under the dual influence of the US-China tariff war and the cyclical curse. This combination of factors has prevented Bitcoin from recovering from last week's losses along with the Nasdaq, instead continuing its downward trend. On top of last week's 6.84% drop, it has fallen another 5.55% this week.
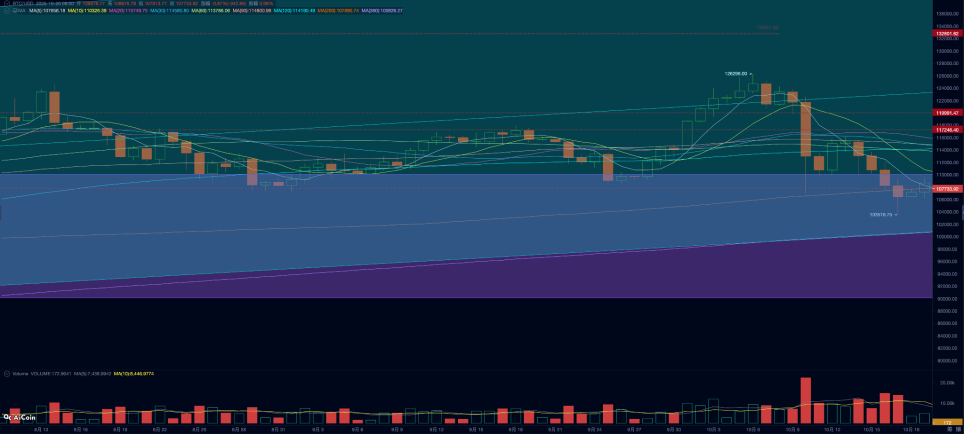
 BTC daily trend

Technically, BTC prices have fallen into the "Trump bottom" range ($90,000-110,000), a range that has held resistance and support for nearly a year since Trump's election in 2024. Furthermore, BTC has also briefly fallen below its 200-day moving average of $107,500, placing it technically on the line separating bull and bear markets.

While BTC prices have fallen below their 200-day moving average several times during this bull market, perhaps this time is different? According to BTC's cyclical patterns, BTC has already entered its peaking phase. It's noteworthy that long-term investors, most influenced by the cyclical patterns, are accelerating their sell-offs, making it difficult for capital inflows into the weakening market to bear the brunt of the pressure.

According to eMerge Engine statistics, the scale of selling by long- and short-term groups this week was 149,496 coins, which was lower than last week. Among them, the long-term group sold 19,978 coins, which was significantly higher than last week.
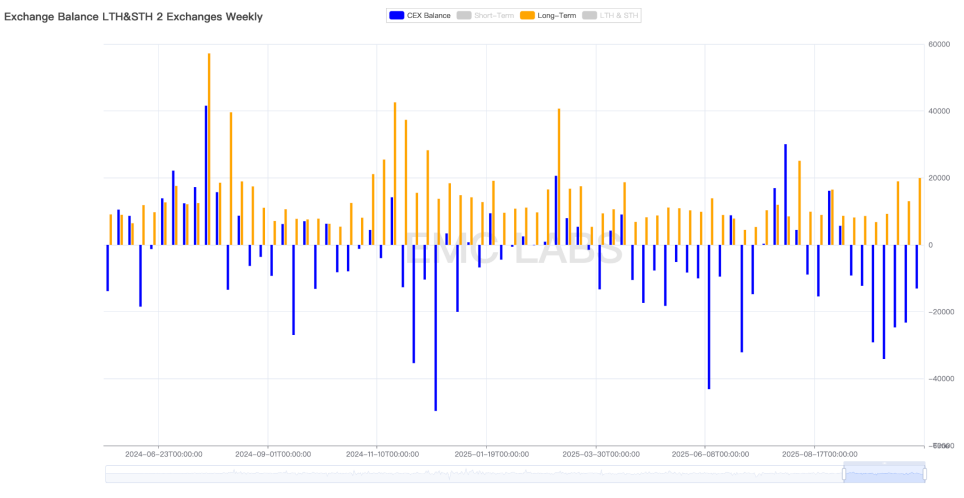
 Statistics on long-term selling and changes in the inventory of centralized exchanges (weekly)

Long-term investors are believers in traditional BTC cycles. Their selling has a profound impact on the market and has been the most important force shaping previous cycle tops. Their continued selling may be due to the "curse" of the cycle. Breaking the old cycle and forming a new one will require the action of greater structural forces (such as DATs and BTC Spot ETF channel funds).

Capital inflows declined again this week, following last week's decline. The BTC Spot ETF saw nearly $1.2 billion in outflows. Short-term capital outflows from ETFs due to the US-China tariff war were another major factor contributing to the rapid and sustained decline in BTC prices, in addition to long-term selling.
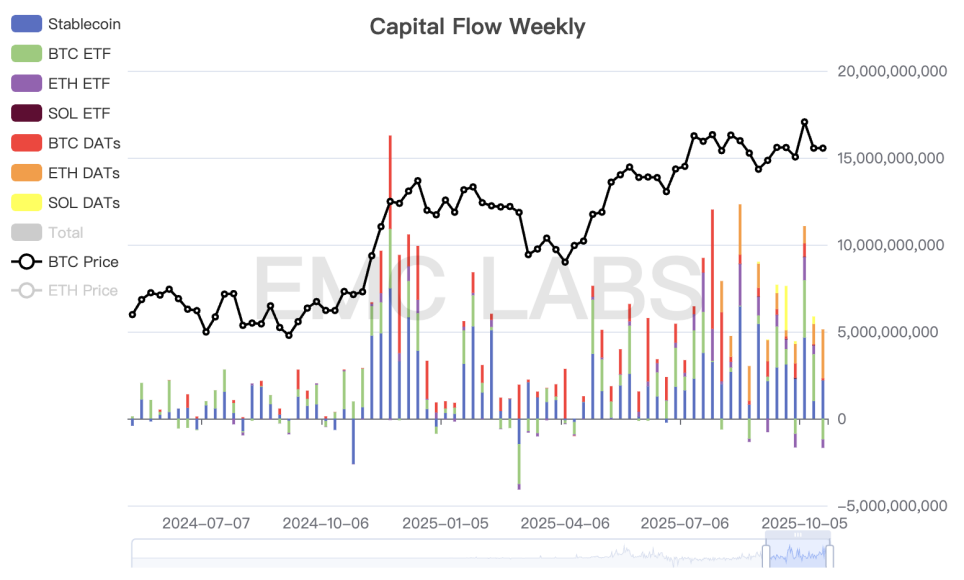
 Crypto Market Capital Flow Statistics (Weekly)

Furthermore, the contract market's open interest continued to decline this week after a sharp drop last week, with fees briefly falling into negative territory. This suggests that long positions in the contract market are struggling to rally in the short term after the massive sell-off.

Judging from technical analysis, long-term selling, capital inflows and outflows, and futures market structure, BTC prices are currently under significant pressure. Unless the US-China tariff war significantly improves and revitalizes market sentiment, a short-term or medium-term reversal is unlikely. Combined with the influence of the cyclical law, we believe long-term investors should position themselves for the end of the cycle. As stated in the September monthly report, the end of the old cycle and the beginning of a new one is a probabilistic event, not impossible, but it is now considered a high-probability event.

Cycle indicators

According to eMerge Engine, the EMC BTC Cycle Metrics indicator is 0, indicating that it is in the transition period.

Disclaimer: The articles reposted on this site are sourced from public platforms and are provided for informational purposes only. They do not necessarily reflect the views of MEXC. All rights remain with the original authors. If you believe any content infringes on third-party rights, please contact service@support.mexc.com for removal. MEXC makes no guarantees regarding the accuracy, completeness, or timeliness of the content and is not responsible for any actions taken based on the information provided. The content does not constitute financial, legal, or other professional advice, nor should it be considered a recommendation or endorsement by MEXC.
Share Insights

You May Also Like

Quote 500: Crypto en AI bedrijven steeds dominanter

Quote 500: Crypto en AI bedrijven steeds dominanter

De nieuwe Quote 500 laat één trend overduidelijk zien: het tijdperk van traditionele familievermogens maakt plaats voor dat van tech miljardairs. Waar vroeger sokken, schepen en supermarkten de bron waren van groot kapitaal, zijn het nu crypto en AI ondernemers die de lijst domineren. Check onze Discord Connect met "like-minded" crypto enthousiastelingen Leer gratis de basis van Bitcoin & trading - stap voor stap, zonder voorkennis. Krijg duidelijke uitleg & charts van ervaren analisten. Sluit je aan bij een community die samen groeit. Nu naar Discord Nieuwe rijkdom in recordtempo Volgens het zakenblad Quote groeit het vermogen van Nederlandse miljonairs en miljardairs “over de hele linie”, maar het zijn vooral AI en crypto die het geld razendsnel laten rollen. “Waar het vroeger decennia of zelfs generaties duurde om een groot vermogen op te bouwen, gebeurt dat nu soms binnen enkele jaren.” Een treffend voorbeeld is Douwe Kiela, die slechts tweeënhalf jaar na de oprichting van zijn AI bedrijf al in de Quote 500 verschijnt. De ondergrens om in de lijst te komen ligt dit jaar op €140 miljoen, een stijging van €10 miljoen ten opzichte van vorig jaar. Crypto miljardairs aan de top De grootste vermogenssprong komt dit jaar van John en Marius Jansen, 2 ondernemers die hun crypto bedrijf verkochten en hun vermogen zagen stijgen van €600 miljoen naar €1,7 miljard. Hun transactie laat zien hoe snel waardecreatie in de crypto sector kan plaatsvinden, een contrast met de langzame vermogensgroei van traditionele industrieën. Hoewel de cryptomarkt grillig blijft, lijkt de invloed van blockchain ondernemers op de Nederlandse elite structureel te worden. Waar eerdere edities van de Quote 500 werden gedomineerd door vastgoed, scheepvaart of retail, komt crypto nu naar voren als nieuwe economische macht. Nieuwe cryptomuntenKom als eerste te weten wat de nieuwste cryptomunten van dit moment zijn! Elke crypto investeerder is er naar op zoek: een nieuwe crypto met groot groeipotentieel. Na de afgelopen crash van de cryptomarkt, is Bitcoin volgens analisten weer klaar voor een stijging. Dat lijkt ook voor altcoins het geval te zijn, nu miljardairs weer volop investeren. Dit zou zomaar eens een nieuwe crypto bull run af kunnen… Continue reading Quote 500: Crypto en AI bedrijven steeds dominanter document.addEventListener('DOMContentLoaded', function() { var screenWidth = window.innerWidth; var excerpts = document.querySelectorAll('.lees-ook-description'); excerpts.forEach(function(description) { var excerpt = description.getAttribute('data-description'); var wordLimit = screenWidth wordLimit) { var trimmedDescription = excerpt.split(' ').slice(0, wordLimit).join(' ') + '...'; description.textContent = trimmedDescription; } }); }); AI als nieuwe gold rush Naast crypto is AI de tweede motor achter de vermogensgroei. Startups in machine learning, dataverwerking en andere AI toepassingen trekken recordinvesteringen, vaak vanuit de Verenigde Staten of het Midden-Oosten. De opkomst van AI ondernemers in de Quote 500 bevestigt dat Nederland zich snel ontwikkelt tot een technologische broedplaats. Bedrijven die enkele jaren geleden nog onbekend waren, hebben nu waarderingen van honderden miljoenen. Klassieke namen dalen of verdwijnen Tegenover de digitale nieuwkomers staan de dalers uit de ‘oude economie’. Zo verliest Els Blokker, weduwe van winkelketen magnaat Jaap Blokker, haar status als miljardair nadat het familievermogen door ruzie werd opgesplitst in drie delen. Ook scheepsbouwer Kommer Damen zag zijn vermogen halveren tot €235 miljoen na tegenvallers bij defensie projecten. En waar tech miljardairs binnenkomen, verdwijnen de sokken en schoenen koningen. Onder anderen Marc Brouwers en de broers Pauli en René Nelissen zijn niet langer rijk genoeg om op de lijst te staan. Een verschuiving van macht en mentaliteit Het aantal miljardairs in Nederland blijft stabiel op 52, maar de samenstelling verandert. De nieuwe elite is jonger, internationaler en digitaal. Hun vermogen komt niet uit bakstenen of olie, maar uit code, algoritmes en tokens. De totale rijkdom van de Quote 500 steeg met 7,9% tot bijna €273 miljard. Het gemiddelde vermogen bedraagt nu €545,5 miljoen. Charlene de Carvalho-Heineken blijft met €12,3 miljard de onbetwiste nummer één, maar de volgende generatie klopt op de deur. Best wallet - betrouwbare en anonieme wallet Best wallet - betrouwbare en anonieme wallet Meer dan 60 chains beschikbaar voor alle crypto Vroege toegang tot nieuwe projecten Hoge staking belongingen Lage transactiekosten Best wallet review Koop nu via Best Wallet Let op: cryptocurrency is een zeer volatiele en ongereguleerde investering. Doe je eigen onderzoek. Het bericht Quote 500: Crypto en AI bedrijven steeds dominanter is geschreven door Gijs Smit en verscheen als eerst op Bitcoinmagazine.nl.
Share
2025/10/29 13:46