Ethereum (ETH) Price Tests Critical $2,040 Support as Bearish Pattern Emerges
Key Takeaways
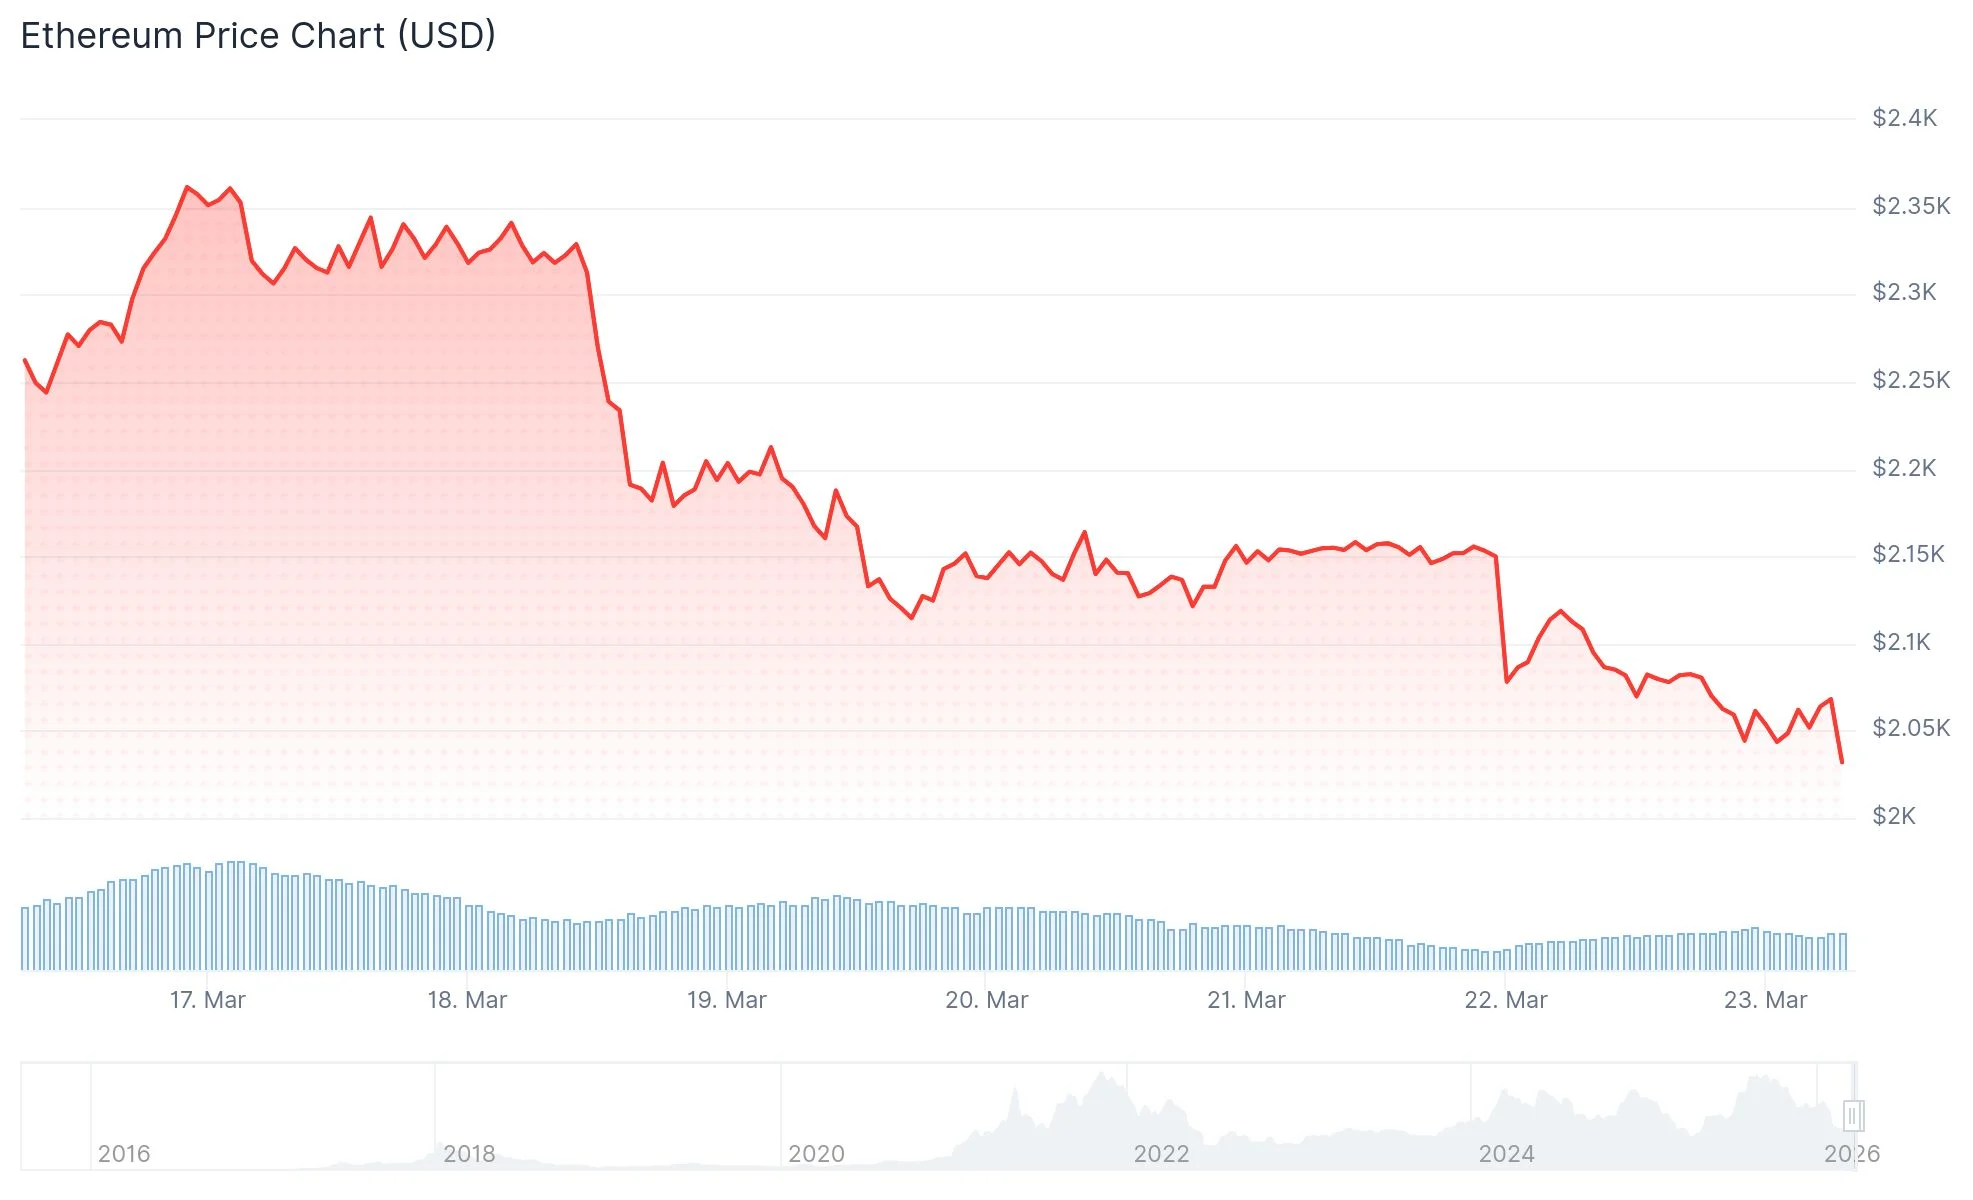
- Ethereum declined from $2,220 to a session low of $2,025, currently consolidating between $2,020 and $2,100
- Dual bearish trend lines present resistance levels at $2,120 and $2,165 on the hourly chart
- Upside breakout above $2,165 may target $2,200–$2,300; downside breach of $2,025 could accelerate decline toward $2,000
- Weekly net outflows from Ethereum spot ETFs totaled $59.94 million, with BlackRock’s ETHA recording $69.59 million in redemptions
- Cumulative net assets in Ethereum spot ETFs now total $12.33 billion, representing 4.79% of ETH’s market capitalization
Ethereum experienced a significant pullback during the last 24 hours, tumbling from approximately $2,385 down to touch $2,025. Currently, ETH is changing hands below the $2,100 mark and remains beneath its 100-hourly Simple Moving Average.
 Ethereum (ETH) Price
The downward momentum initiated when ETH couldn’t maintain levels above $2,220. Subsequently, the cryptocurrency breached support at $2,150 and $2,120, momentarily dipping beneath $2,050.
Currently, ETH is attempting to stabilize below the 23.6% Fibonacci retracement level, measured from the swing high of $2,385 down to the recent low of $2,025. Technical analysis reveals two descending trend lines on the hourly timeframe, establishing resistance zones at $2,120 and $2,165.
The immediate resistance barrier stands at $2,120, which coincides with the 100-hourly Simple Moving Average. Breaking through this level would bring $2,165 into focus as the subsequent obstacle.
Should Ethereum successfully clear $2,165, the 50% Fibonacci retracement level around $2,200 becomes the next target. Momentum beyond this area could potentially drive prices toward $2,250 or even $2,300.
Critical Support Zones Under Watch
Looking at downside scenarios, immediate support is established around $2,040. Beneath this level, $2,025 represents the primary support floor.
A decisive breakdown below $2,025 would shift attention to the psychological $2,000 threshold. Additional selling pressure could expose $1,965, with $1,880 serving as a more substantial support zone.
Market technician Ted Pillows shared his perspective on X, identifying a potential head and shoulders formation in ETH. His analysis stated: “$ETH seems to be forming head and shoulder pattern. If Ethereum loses the $2,040 level, expect a massive dump.”
Institutional Outflows Compound Bearish Sentiment
Ethereum spot ETF products experienced aggregate net outflows of $59.94 million during the trading week spanning March 16 through March 20, based on SoSoValue data shared by PANews on March 23.
BlackRock’s ETHA product dominated outflows, recording $69.59 million in net redemptions during the period. Despite this weekly exodus, ETHA maintains a cumulative historical net inflow of $11.91 billion.
Fidelity’s FETH product experienced $61.62 million in withdrawals throughout the same timeframe. The fund’s lifetime total net inflow remains at $2.32 billion.
The Grayscale Ethereum Mini Trust (ETH) stood as the sole product registering positive flows last week, attracting $6.87 million in new investments. This brings its cumulative historical net inflow to $1.85 billion.
As of March 23, aggregate net assets across all Ethereum spot ETF products total $12.33 billion, accounting for 4.79% of Ethereum’s overall market capitalization. The combined historical net inflow across the entire ETF ecosystem stands at $11.73 billion.
The post Ethereum (ETH) Price Tests Critical $2,040 Support as Bearish Pattern Emerges appeared first on Blockonomi.
You May Also Like

Here’s How Much $100, $500, and $1,000 in Little Pepe (LILPEPE) Will Be Worth if the Price Hits $3 in 2026

Synopsys (SNPS) Stock — Elliott Investment Builds Multibillion-Dollar Stake