The average return rate of the five major exchanges, Binance, OKX, Bitget, KuCoin and Bybit, was negative.The average return rate of the five major exchanges, Binance, OKX, Bitget, KuCoin and Bybit, was negative.

Research: Performance of Coin Listings of Top Five Exchanges, including Binance and OKX, in the First Three Quarters

2024/11/02 14:51
5 min read

By Animoca Digital Research

Compiled by: Felix, PANews.

Animoca Digital Research released a research report that analyzed the listing status of the five major exchanges, Binance, OKX, Bitget, KuCoin and Bybit, from a data perspective. The report details are as follows:

Listed Coin Performance Overview

Research: Performance of Coin Listings of Top Five Exchanges, including Binance and OKX, in the First Three Quarters

Research: Performance of Coin Listings of Top Five Exchanges, including Binance and OKX, in the First Three Quarters

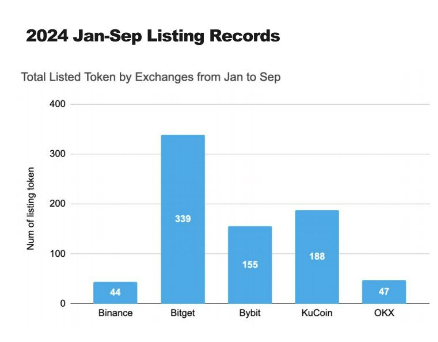
This year, leading exchanges have adopted different coin listing strategies.

Binance and OKX have been more selective among the major exchanges, listing only 44 and 47 tokens respectively so far this year.

In sharp contrast, Bitget has adopted a more aggressive listing strategy, with 339 listed tokens, far exceeding its competitors and significantly increasing its market share in 2024.

So far this year, both KuCoin and Bybit have listed more than 150 tokens.

Average return rate of each exchange

Research: Performance of Coin Listings of Top Five Exchanges, including Binance and OKX, in the First Three Quarters

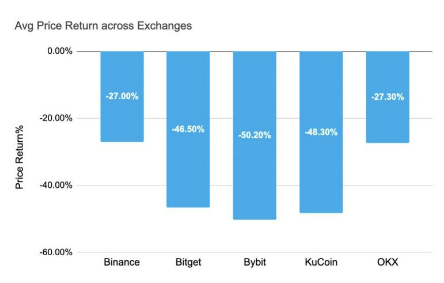
Year-to-date, most exchanges have seen negative average returns, with Bybit seeing the largest drop in average returns at -50.20%.

KuCoin followed closely behind with an average return of -48.30%, while Bitget’s average return was -46.50%.

In contrast, Binance and OKX performed relatively well, with average returns of -27.00% and -27.30% respectively. This suggests that Binance and OKX implemented a more effective selective listing strategy, and token prices performed relatively well in the challenging altcoin market environment.

List the number of coins listed by month

Research: Performance of Coin Listings of Top Five Exchanges, including Binance and OKX, in the First Three Quarters

Given the favorable market conditions at the beginning of the year, March and April became the peak months for listings on various exchanges, especially Bitget, Bybit, and KuCoin, where the number of listings surged significantly. In April, the total number of listings reached a peak of 133, while August had the lowest number of listings, with only 44. Since April, the number of listings on most exchanges has been steadily declining until August.

Total token trading volume in the first month of launch

Research: Performance of Coin Listings of Top Five Exchanges, including Binance and OKX, in the First Three Quarters

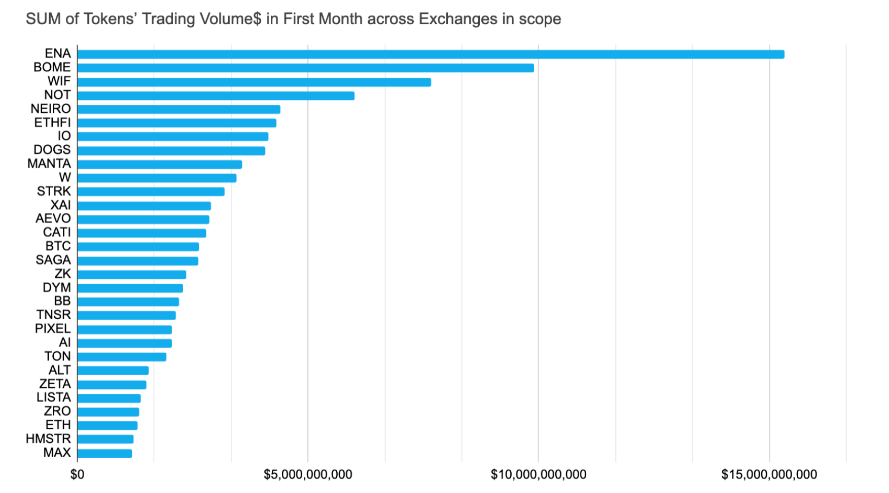
The above chart shows the 30 most traded tokens so far this year. ENA leads the pack with over $15 billion in trading volume in the first month. Among the popular meme tokens, BOME, NElRO, and WIF have seen significant increases in trading activity, while tokens such as ZRO, TON, and lO have seen trading volumes ranging from $1 billion to $5 billion in the first month.

MC/FDV Ratio vs. Average Token FDV

Research: Performance of Coin Listings of Top Five Exchanges, including Binance and OKX, in the First Three Quarters

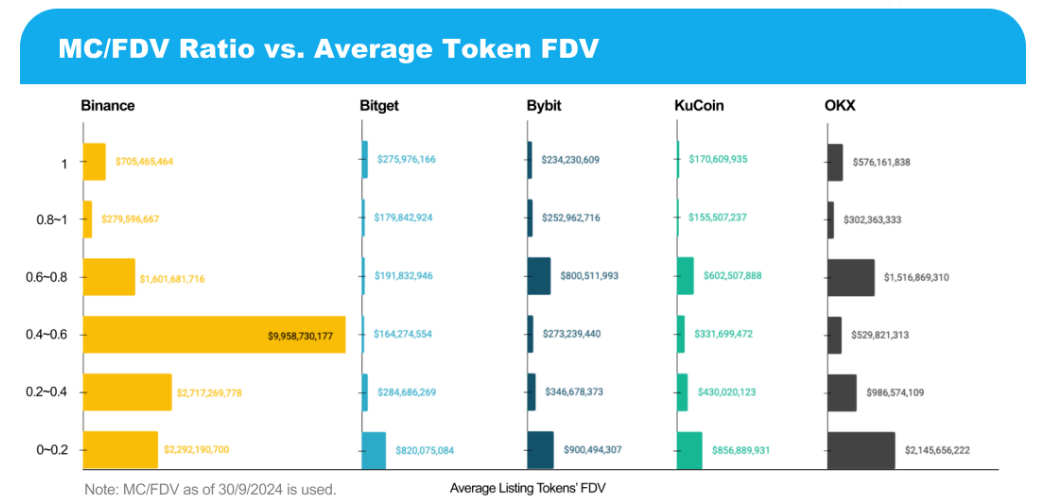
MC/FDV (market capitalization to fully diluted valuation) is a key metric for evaluating a token’s floating market capitalization relative to its total valuation. Analysis of the rankings shows that projects with lower circulation ratios tend to push up their valuations.

For Binance, tokens in the 0.4 to 0.6 range account for the largest share of fully diluted valuations. This is mainly due to the recent launches of TON, BANANA, and XAl. Meanwhile, tokens in the 0 to 0.4 range, such as TAO, JUP, ENA, and ZRO, also made significant contributions to the overall FDV.

OKX has a higher concentration of tokens in the 0.6 to 0.8 and 0 to 0.2 ranges. Notable high FDV listings so far this year include JUP, ONDO, ZRO, STRK, and ZK.

The remaining three exchanges have listed tokens with lower FDVs, reflecting the diversification of their token selection strategies, and may also be due to the lag of Binance and OKX in listing high FDV tokens.

Number of tokens listed at different MC/FDV ratios

Research: Performance of Coin Listings of Top Five Exchanges, including Binance and OKX, in the First Three Quarters

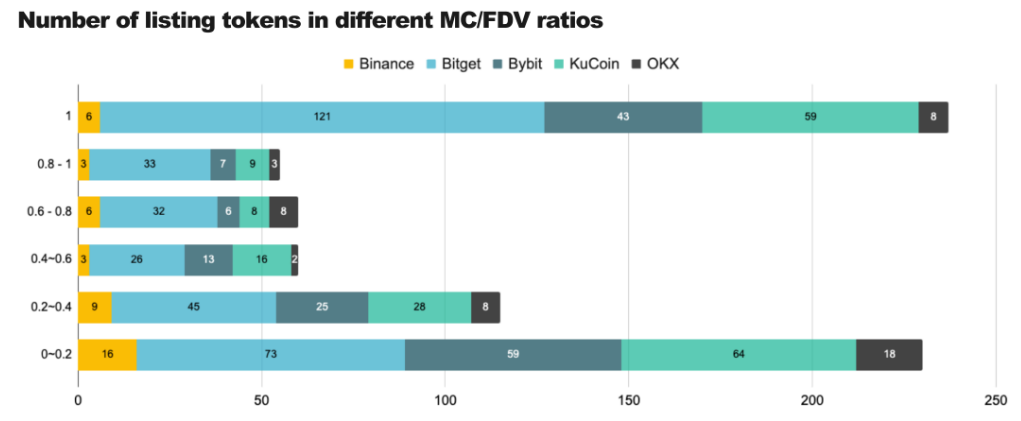
When analyzing the distribution of tokens with different MC/FDV ratios, a noteworthy trend emerges: most tokens tend to cluster at extremely high or low MC/FDV ratios, and the same is true for the circulation percentage.

Interestingly, the highest valued tokens are those in the middle of the MC/FDV range. This suggests that tokens that demonstrate both established market presence and growth potential tend to attract greater interest from investors.

Trading volume by exchange and launch month

Trading volume trends in the last 24 hours (by exchange and listing month)

Research: Performance of Coin Listings of Top Five Exchanges, including Binance and OKX, in the First Three Quarters

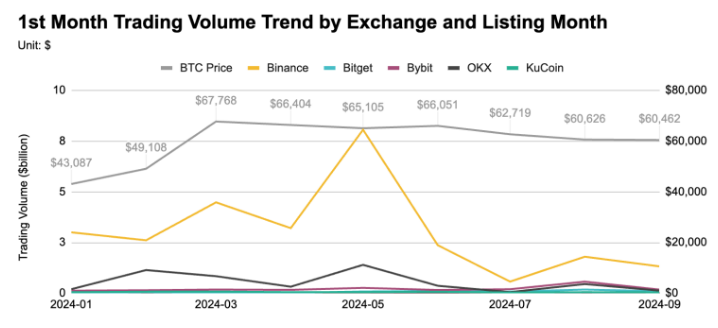
First month trading volume trends (by exchange and launch month)

Research: Performance of Coin Listings of Top Five Exchanges, including Binance and OKX, in the First Three Quarters

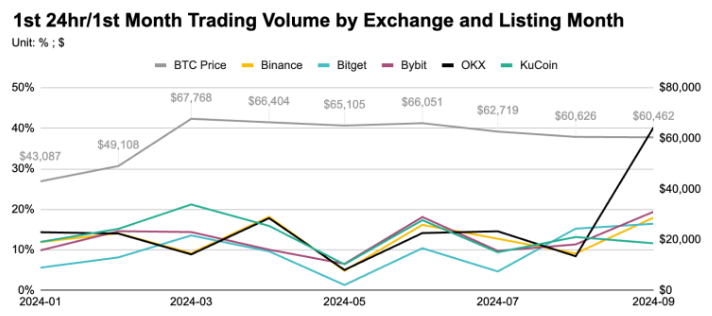
First 24- hour / first month trading volume by exchange and launch month

Research: Performance of Coin Listings of Top Five Exchanges, including Binance and OKX, in the First Three Quarters

First day trading activity:

After going live, the first 24 hours of trading volume typically accounted for 5-20% of the first month’s volume, depending on the exchange. OKX was recorded as an outlier in September, with 40% of its activity driven by CATl and HMSTR tokens, while KuCoin showed stronger participation in the first few months.

Volume:

Among the five exchanges, Binance leads the market in both first 24 hours and first month average volume, followed by OKX. For Binance, April was the peak for average first day volume, while May was the peak for first month volume. Both volume metrics reached their lowest point in July and partially recovered in August and September. A similar decline and recovery trend can be observed in OKX.

First day closing price and ATH price (by exchange and listing month)

Average time from launch to ATH (by exchange and launch month)

Research: Performance of Coin Listings of Top Five Exchanges, including Binance and OKX, in the First Three Quarters

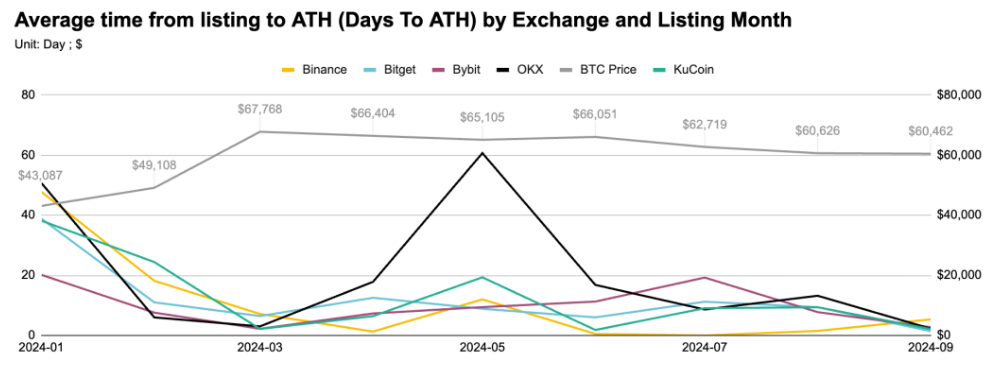
 Average number of days it takes for a newly listed token to reach its all-time high (ATH) after listing

Average ATH ROl by exchange and launch month

Research: Performance of Coin Listings of Top Five Exchanges, including Binance and OKX, in the First Three Quarters

 ATH ROI % (average percentage change between ATH and previous price)

Online performance:

Based on the ratio of ATH price to first-day price, Bybit and Bitget had the highest average ATH ROL between April and July. Meanwhile, Binance was the fastest of the five exchanges to reach a new all-time high (ATH) between January and March, a period when Bitcoin’s price fluctuated significantly.

The shift in market greed:

When BTC price surges, the number of days reaching ATH decreases, likely due to increased investor interest in newly listed tokens between January and March, during which BTC experienced significant price volatility.

Related reading: CZ's first public sharing after his return: prison life, market views and future plans

Market Opportunity
TOP Network Logo
TOP Network Price(TOP)
$0.000096
$0.000096$0.000096
0.00%
USD
TOP Network (TOP) Live Price Chart
Disclaimer: The articles reposted on this site are sourced from public platforms and are provided for informational purposes only. They do not necessarily reflect the views of MEXC. All rights remain with the original authors. If you believe any content infringes on third-party rights, please contact service@support.mexc.com for removal. MEXC makes no guarantees regarding the accuracy, completeness, or timeliness of the content and is not responsible for any actions taken based on the information provided. The content does not constitute financial, legal, or other professional advice, nor should it be considered a recommendation or endorsement by MEXC.
Tags:

You May Also Like

Over 60% of crypto press releases linked to high-risk or scam projects: Report

Over 60% of crypto press releases linked to high-risk or scam projects: Report

A data analysis shows crypto press release wires are dominated by scam-linked projects, hype-driven content and low-impact announcements, raising concerns about
Share
Crypto.news2026/02/04 22:02
ArtGis Finance Partners with MetaXR to Expand its DeFi Offerings in the Metaverse

ArtGis Finance Partners with MetaXR to Expand its DeFi Offerings in the Metaverse

By using this collaboration, ArtGis utilizes MetaXR’s infrastructure to widen access to its assets and enable its customers to interact with the metaverse.
Share
Blockchainreporter2025/09/18 00:07
Crucial US Stock Market Update: What Wednesday’s Mixed Close Reveals

Crucial US Stock Market Update: What Wednesday’s Mixed Close Reveals

BitcoinWorld Crucial US Stock Market Update: What Wednesday’s Mixed Close Reveals The financial world often keeps us on our toes, and Wednesday was no exception. Investors watched closely as the US stock market concluded the day with a mixed performance across its major indexes. This snapshot offers a crucial glimpse into current investor sentiment and economic undercurrents, prompting many to ask: what exactly happened? Understanding the Latest US Stock Market Movements On Wednesday, the closing bell brought a varied picture for the US stock market. While some indexes celebrated gains, others registered slight declines, creating a truly mixed bag for investors. The Dow Jones Industrial Average showed resilience, climbing by a notable 0.57%. This positive movement suggests strength in some of the larger, more established companies. Conversely, the S&P 500, a broader benchmark often seen as a barometer for the overall market, experienced a modest dip of 0.1%. The technology-heavy Nasdaq Composite also saw a slight retreat, sliding by 0.33%. This particular index often reflects investor sentiment towards growth stocks and the tech sector. These divergent outcomes highlight the complex dynamics currently at play within the American economy. It’s not simply a matter of “up” or “down” for the entire US stock market; rather, it’s a nuanced landscape where different sectors and company types are responding to unique pressures and opportunities. Why Did the US Stock Market See Mixed Results? When the US stock market delivers a mixed performance, it often points to a tug-of-war between various economic factors. Several elements could have contributed to Wednesday’s varied closings. For instance, positive corporate earnings reports from certain industries might have bolstered the Dow. At the same time, concerns over inflation, interest rate policies by the Federal Reserve, or even global economic uncertainties could have pressured growth stocks, affecting the S&P 500 and Nasdaq. Key considerations often include: Economic Data: Recent reports on employment, manufacturing, or consumer spending can sway market sentiment. Corporate Announcements: Strong or weak earnings forecasts from influential companies can significantly impact their respective sectors. Interest Rate Expectations: The prospect of higher or lower interest rates directly influences borrowing costs for businesses and consumer spending, affecting future profitability. Geopolitical Events: Global tensions or trade policies can introduce uncertainty, causing investors to become more cautious. Understanding these underlying drivers is crucial for anyone trying to make sense of daily market fluctuations in the US stock market. Navigating Volatility in the US Stock Market A mixed close, while not a dramatic downturn, serves as a reminder that market volatility is a constant companion for investors. For those involved in the US stock market, particularly individuals managing their portfolios, these days underscore the importance of a well-thought-out strategy. It’s important not to react impulsively to daily movements. Instead, consider these actionable insights: Diversification: Spreading investments across different sectors and asset classes can help mitigate risk when one area underperforms. Long-Term Perspective: Focusing on long-term financial goals rather than short-term gains can help weather daily market swings. Stay Informed: Keeping abreast of economic news and company fundamentals provides context for market behavior. Consult Experts: Financial advisors can offer personalized guidance based on individual risk tolerance and objectives. Even small movements in major indexes can signal shifts that require attention, guiding future investment decisions within the dynamic US stock market. What’s Next for the US Stock Market? Looking ahead, investors will be keenly watching for further economic indicators and corporate announcements to gauge the direction of the US stock market. Upcoming inflation data, statements from the Federal Reserve, and quarterly earnings reports will likely provide more clarity. The interplay of these factors will continue to shape investor confidence and, consequently, the performance of the Dow, S&P 500, and Nasdaq. Remaining informed and adaptive will be key to understanding the market’s trajectory. Conclusion: Wednesday’s mixed close in the US stock market highlights the intricate balance of forces influencing financial markets. While the Dow showed strength, the S&P 500 and Nasdaq experienced slight declines, reflecting a nuanced economic landscape. This reminds us that understanding the ‘why’ behind these movements is as important as the movements themselves. As always, a thoughtful, informed approach remains the best strategy for navigating the complexities of the market. Frequently Asked Questions (FAQs) Q1: What does a “mixed close” mean for the US stock market? A1: A mixed close indicates that while some major stock indexes advanced, others declined. It suggests that different sectors or types of companies within the US stock market are experiencing varying influences, rather than a uniform market movement. Q2: Which major indexes were affected on Wednesday? A2: On Wednesday, the Dow Jones Industrial Average gained 0.57%, while the S&P 500 edged down 0.1%, and the Nasdaq Composite slid 0.33%, illustrating the mixed performance across the US stock market. Q3: What factors contribute to a mixed stock market performance? A3: Mixed performances in the US stock market can be influenced by various factors, including specific corporate earnings, economic data releases, shifts in interest rate expectations, and broader geopolitical events that affect different market segments uniquely. Q4: How should investors react to mixed market signals? A4: Investors are generally advised to maintain a long-term perspective, diversify their portfolios, stay informed about economic news, and avoid impulsive decisions. Consulting a financial advisor can also provide personalized guidance for navigating the US stock market. Q5: What indicators should investors watch for future US stock market trends? A5: Key indicators to watch include upcoming inflation reports, statements from the Federal Reserve regarding monetary policy, and quarterly corporate earnings reports. These will offer insights into the future direction of the US stock market. Did you find this analysis of the US stock market helpful? Share this article with your network on social media to help others understand the nuances of current financial trends! To learn more about the latest stock market trends, explore our article on key developments shaping the US stock market‘s future performance. This post Crucial US Stock Market Update: What Wednesday’s Mixed Close Reveals first appeared on BitcoinWorld.
Share
Coinstats2025/09/18 05:30