Pepe coin price forms potential base after 73% collapse — will 23T whale accumulation spark reversal?
Pepe coin price is hovering near a critical support zone as large holders quietly accumulate 23.02 trillion tokens despite a 73% market cap drawdown.
- Top 100 wallets accumulated 23.02T PEPE over four months.
- Price continues to print lower highs and lower lows on the daily timeframe.
- RSI sits in the mid-30s while price trades below the 50-day MA.
Pepe was trading at $0.0000036 at press time, down about 6% in the last 24 hours. Losses extend across higher timeframes. The token is off 16% in the past week and nearly 42% over the past month, reflecting persistent pressure in the meme coin segment.
Spot activity has cooled. Trading volume slipped 13% to $274 million, suggesting participation remains selective. In derivatives markets, futures volume declined 12% to $430 million, while open interest rose 10% to $221 million, according to CoinGlass data.
When open interest increases as price drifts lower, it often suggests fresh short positioning rather than aggressive long exposure.
Large holders continue accumulating despite 73% drawdown
On-chain data, however, presents a different layer of the story.
Santiment reported on Feb. 11 that the top 100 Pepe (PEPE) wallets have accumulated 23.02 trillion tokens over the past four months. The buying began around the October market correction and has continued steadily, even as broader sentiment toward meme coins remains weak.
This accumulation has taken place while PEPE has lost roughly 73% of its market capitalization from its cycle high nearly nine months ago. That context matters.
When large wallets absorb supply during extended declines, circulating liquidity tightens. There are fewer tokens available for purchase. Because overhead supply has already been decreased, the price can move more quickly if demand later returns, even slightly.
Similar accumulation phases preceded sharp upward moves once momentum shifted in previous meme coin cycles. However, accumulation by itself does not ensure reversal. Although it sets the stage for a rise, the price structure must confirm that buyers are willing to step in at higher levels.
Pepe coin price technical analysis
From a chart perspective, PEPE continues to print lower highs and lower lows on the daily timeframe. The broader trend has not yet changed.
The token trades below its 50-day moving average, currently near $0.0000043, and that average has begun to slope downward. Each recovery attempt has been capped beneath prior swing highs.
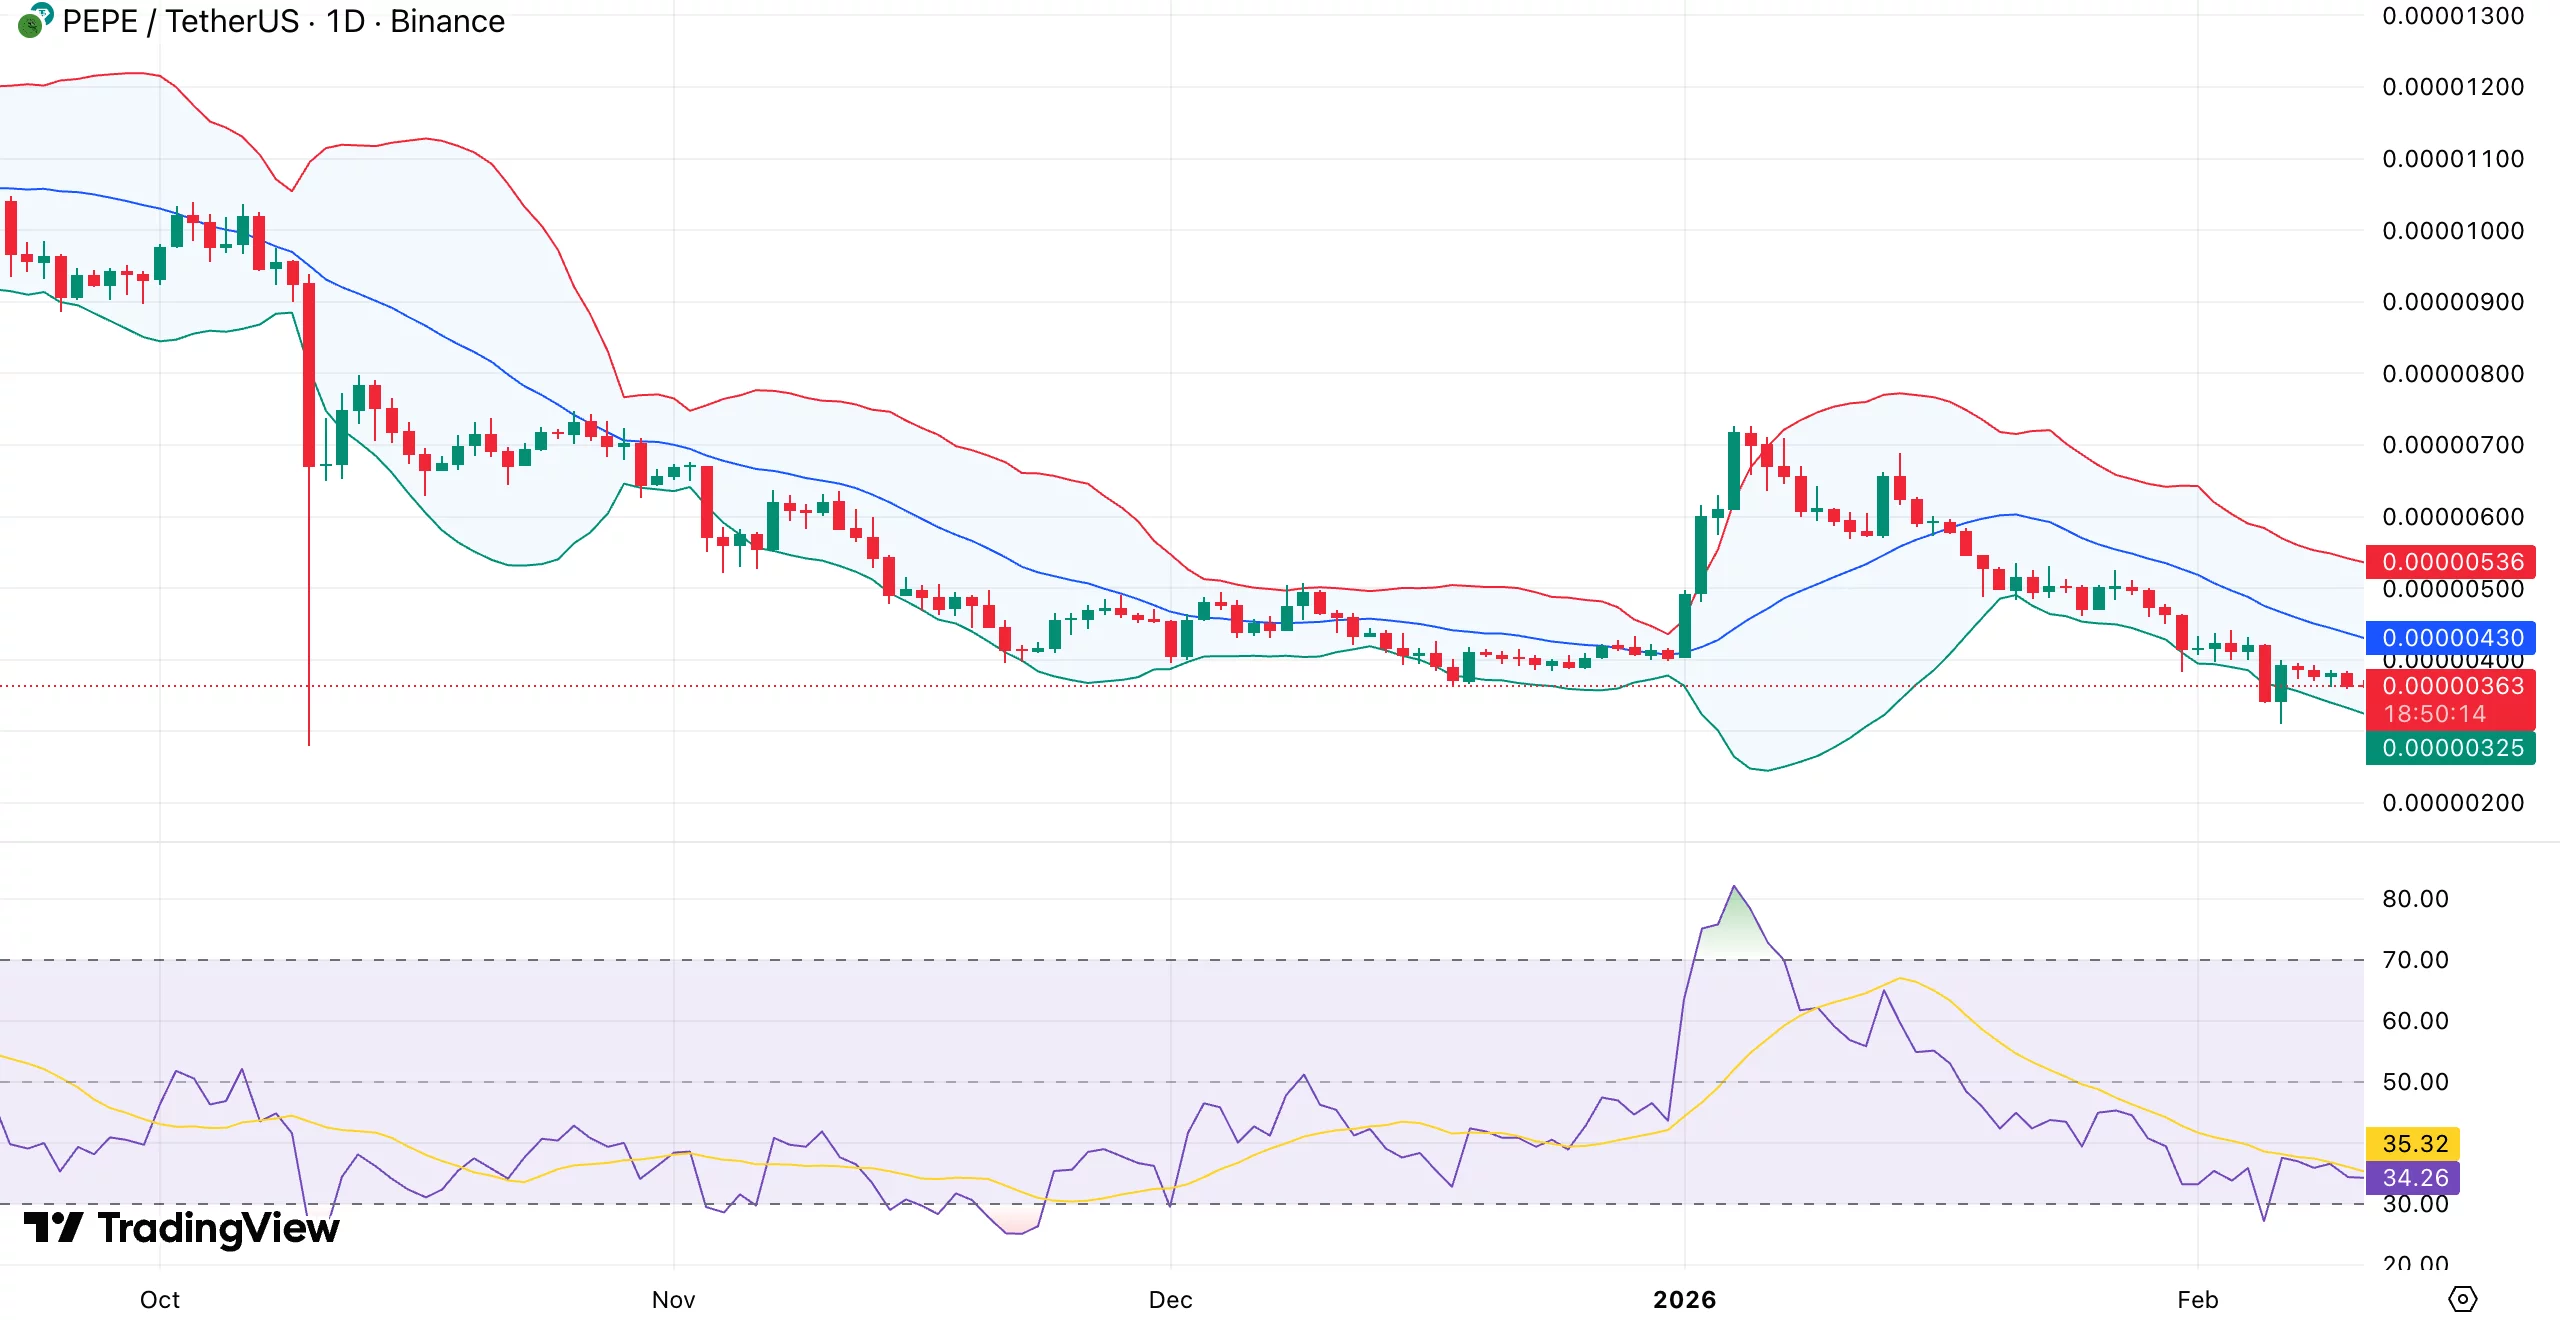
Price has repeatedly tested the $0.0000032–$0.0000036 zone. So far, that support area has held, but the reactions have grown weaker. Smaller candle bodies are now forming, and range expansion has slowed. Volatility is compressing rather than accelerating.
The Bollinger Bands have narrowed compared to previous weeks. The lower band has flattened, and the price is no longer aggressively riding it. When bands contract like this, a larger move often follows. Direction will depend on which boundary breaks first.
Momentum remains soft. The daily relative strength index briefly dipped below 30 and has stabilized in the 34–35 range, still well under the neutral 50 level. No confirmed bullish divergence has formed yet. Although strength has not returned, downside pressure has decreased.
A daily close below $0.0000032 would probably reveal the psychological $0.0000030 level. If that fails, there might be deeper support near $0.0000028, where buyers have previously intervened.
To move higher, bulls need to recover $0.0000043, which is in line with the 50-day moving average and the Bollinger mid-band. A prolonged break above that level could make the next visible supply zone, $0.0000053, accessible.
The price would need to push the RSI back toward 45–50, break above $0.0000043 with increasing volume, and print a higher high on the daily chart in order for the shift to be confirmed as bullish.
You May Also Like

LTC Cloud Mining aims to make mining simple and accessible

Xenea Wallet Daily Quiz 11 February 2026: Claim Your Free Crypto Coins Now