Uniswap price: UNI looks washed out on the daily, but intraday shows first signs of a bounce

UNI is trading around $3.92 against USDT, sitting deep in a medium-term downtrend but starting to base out on intraday timeframes as the Uniswap price shows conflicting signals across charts.
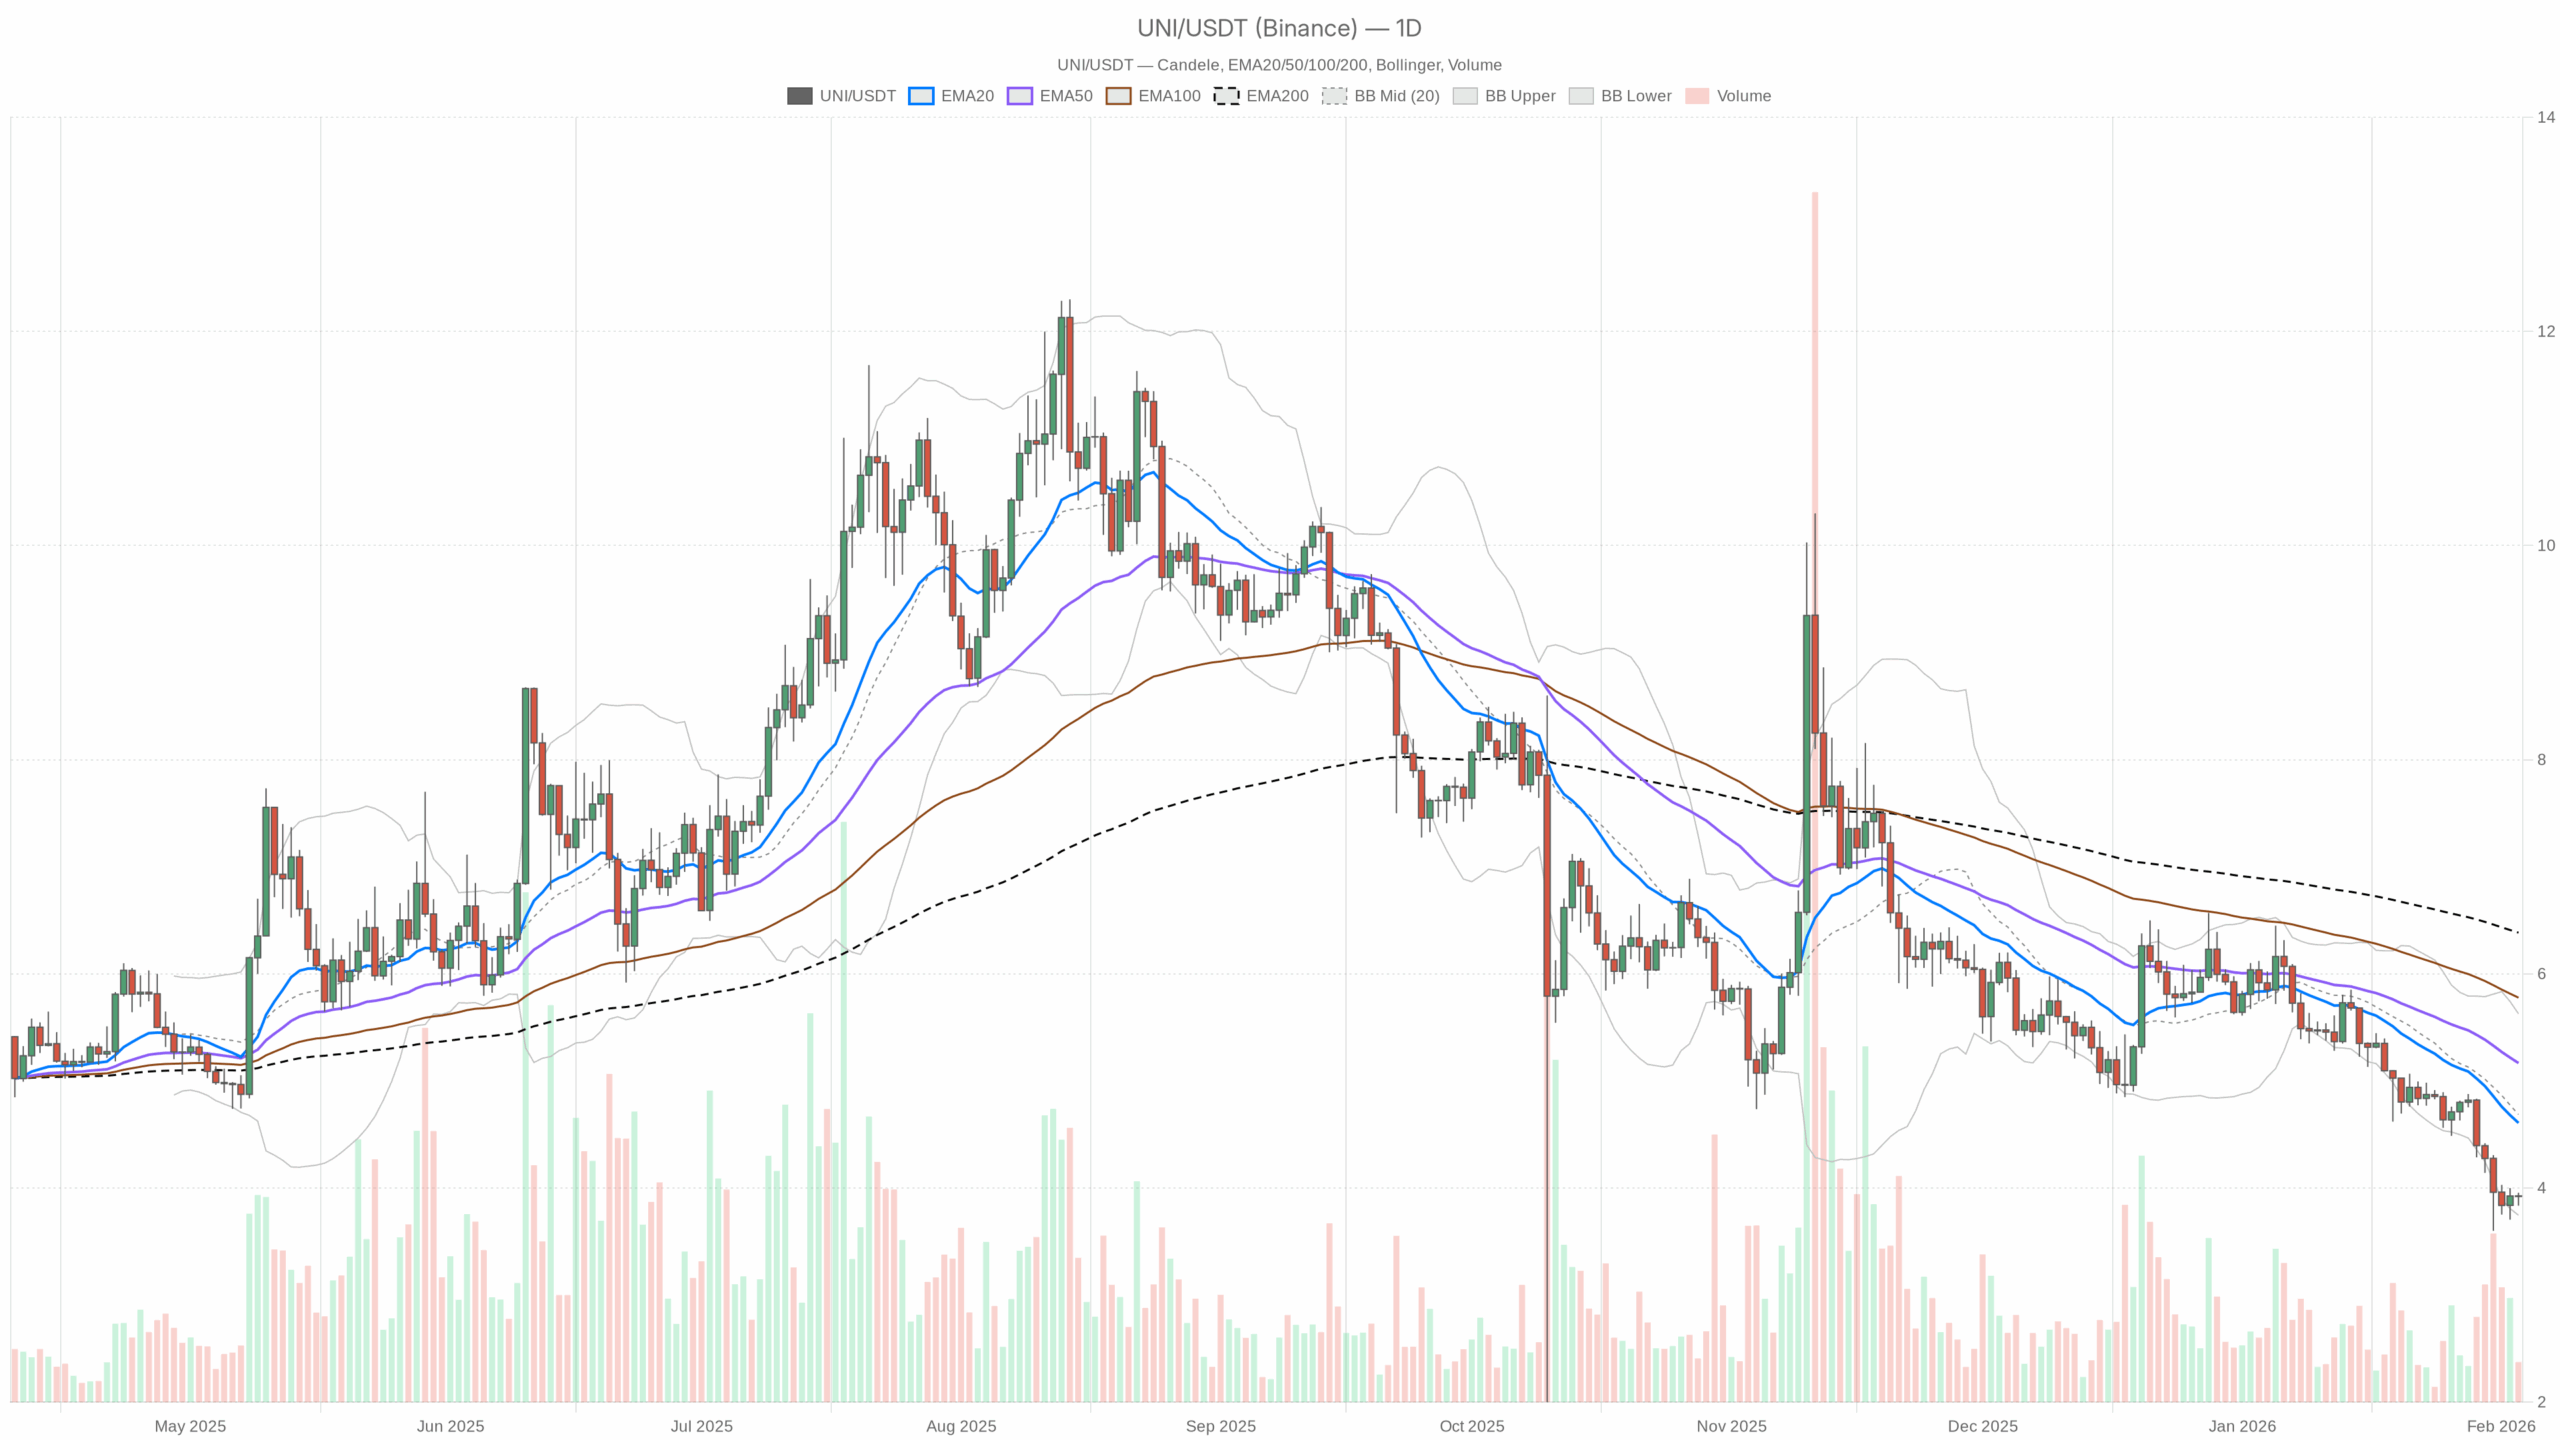 UNI/USDT daily chart with EMA20, EMA50 and volume”
loading=”lazy” />UNI/USDT — daily chart with candlesticks, EMA20/EMA50 and volume.
Daily timeframe (D1): Main scenario is bearish, but stretched
The daily trend is unambiguously bearish. Price at $3.92 is well below all key moving averages and hugging the lower Bollinger Band. This is a classic late-trend area where downside momentum still dominates, but incremental new selling has to work harder to push price much lower.
Trend structure: EMA20, EMA50, EMA200
– EMA20: $4.61
– EMA50: $5.17
– EMA200: $6.38
UNI is trading far below the 20, 50 and 200-day EMAs, with a clean bearish stack (price < EMA20 < EMA50 < EMA200). That is textbook downtrend structure: sellers have been in control for weeks, and every bounce so far has been sold into. The distance to the short-term EMA20 is notable; being about $0.70 under the 20-day average signals a market that is not just in a downtrend, but currently pulled away from its mean. In practice, that keeps the main scenario bearish, but also opens the door to a sharp snapback rally if sellers lose steam.
Momentum: RSI
– RSI (14): 26.45
Daily RSI is well below 30, firmly in oversold territory. That tells you the selloff has been intense and persistent. Historically, levels like this often precede either a volatility flush, with a final quick leg down, or a relief bounce. It does not automatically mean a bottom is in, but it does mean fresh shorts are late to the party on the daily.
Momentum & trend quality: MACD
– MACD line: -0.41
– Signal: -0.33
– Histogram: -0.08
The MACD line is below the signal and both are in negative territory, which is consistent with the established downtrend. The histogram is negative but not large, hinting that bearish momentum is present but not accelerating aggressively. So the trend is still down, but the worst-of-the-worst momentum phase might already be behind us, aligning with that oversold RSI backdrop.
Volatility & price location: Bollinger Bands
– Middle band: $4.69
– Upper band: $5.63
– Lower band: $3.75
– Close: $3.92
UNI is trading just above the lower Bollinger Band. That tells you price is parked on the lower edge of its recent volatility range. This is the kind of zone where you often see either continued walking down the band in a strong trend, or a mean-reversion push back toward the middle band near $4.69. Given the oversold RSI, there is a growing risk of a short-covering bounce back toward the mid-band, but so far there is no clear daily reversal signal.
Volatility & risk: ATR
– ATR(14): $0.28
A daily ATR around $0.28 on a $3.92 asset means typical daily swings are roughly 7% of price. That is not extreme by crypto standards but it is meaningful: a single daily candle can easily wipe out tight stops. For traders, position sizing has to respect that a normal day can move UNI about $0.25–0.30 either way.
Short-term reference levels: Daily pivots
– Pivot point (PP): $3.90
– R1: $3.97
– S1: $3.85
Price is hovering essentially on top of the daily pivot at $3.90–3.92. That shows a short-term equilibrium level inside a larger downtrend. R1 at $3.97 is the first immediate upside friction zone; a sustained move above that would be an early sign of intraday buyers trying to challenge the daily bearish bias. S1 at $3.85 is the nearby support that, if lost cleanly, would confirm that the downtrend is still grinding lower.
Daily takeaway: The main scenario remains bearish: the trend is down, structure is bearish, and price is below all major averages. However, with RSI oversold and price hugging the lower band, UNI is entering a fragile zone where downside continuation offers diminishing reward relative to the risk of a sharp, sentiment-driven bounce.
1H timeframe (H1): Neutralizing after the dump
The 1-hour chart is where the story gets more nuanced. While the daily chart screams downtrend, the 1H regime is marked as neutral, and the indicators back that up. Price is coiling around key intraday averages and the Bollinger mid-band, hinting that the immediate sell pressure has faded, at least for now.
EMAs on H1
– EMA20: $3.91
– EMA50: $3.93
– EMA200: $4.24
– Close: $3.92
On the hourly, UNI is trading right around the 20 and 50 EMAs, with both clustered in a tight range. That reflects a market that has stopped trending intraday and is instead consolidating. The EMA200 up at $4.24 is still far overhead, reminding you that this is consolidation inside a broader downtrend. In plain terms, the intraday slide has paused, but the bigger picture is still heavy.
RSI on H1
– RSI (14): 52.72
Hourly RSI near 53 is basically middle of the road. Selling pressure has been absorbed, and buyers have just enough energy to hold price stable without yet turning it into a clear uptrend. That supports the idea of a short-term balance zone rather than an immediate breakdown or breakout.
MACD on H1
– MACD line: 0.00
– Signal: 0.00
– Histogram: 0.00
MACD being essentially flat at zero confirms the lack of a strong intraday trend. Momentum has reset on the 1H. The market is neither in a powerful bounce nor in an active flush lower. That fits with the neutral regime tag for this timeframe.
Bollinger Bands on H1
– Middle band: $3.91
– Upper band: $3.96
– Lower band: $3.87
– Close: $3.92
Price is trading essentially at the Bollinger mid-band and well inside the bands. After pressing the lower edges on the way down, UNI is now in a calmer, range-like behavior on the hourly. This often precedes a bigger move; the question is whether this consolidation breaks up as a relief rally or rolls over to extend the daily downtrend.
ATR & intraday pivots on H1
– ATR(14): $0.04
– Pivot point: $3.93
– R1: $3.93
– S1: $3.92
An hourly ATR of about $0.04 means typical 1H candles cover about 1% of price. That is moderate intraday volatility, enough to shake out tight stops but not a wild tape. The pivot levels are extremely compressed, with PP and R1 both at $3.93 and S1 at $3.92, which underlines how flat the intraday structure currently is. The market is catching its breath here.
15-minute timeframe (M15): Execution context, slight intraday bullish tilt
The 15-minute chart is there mainly for execution, and it leans mildly constructive compared to the higher timeframes. The regime is neutral, but the indicators show a small intraday bullish bias.
EMAs on M15
– EMA20: $3.91
– EMA50: $3.91
– EMA200: $3.92
– Close: $3.92
All the short-term EMAs are practically on top of each other with price just above them. That is a classic micro-consolidation structure where the market is balanced but tilting slightly in favor of the buyers as long as price holds above that $3.91–3.92 cluster.
RSI on M15
– RSI (14): 57.43
Short-term RSI around 57 shows a mild bullish bias intraday. It is not overheated, but it does say buyers have the upper hand in this small window of time, helping support price at current levels.
MACD on M15
– MACD line: 0.00
– Signal: 0.00
– Histogram: 0.01
The marginally positive histogram on the 15m chart reflects a gentle upward push in the very near term, which is consistent with the slightly bullish RSI. Momentum is positive but still fragile; this is early-stage stabilization, not a strong intraday uptrend.
Bollinger Bands & ATR on M15
– Middle band: $3.90
– Upper band: $3.94
– Lower band: $3.86
– ATR(14): $0.02
UNI is hovering near the middle-to-upper half of its 15m band structure, with a narrow band width and a small ATR of $0.02. That tells you the market is in a low-volatility pause. These periods rarely last; they usually resolve with a volatility expansion in one direction or the other.
How the timeframes fit together
There is a clear tension between timeframes:
– The daily chart is firmly bearish but visibly oversold.
– The 1H is neutral, signaling that the latest wave of selling is pausing.
– The 15m is showing a small bullish lean, with price slightly above key short EMAs and RSI biased higher.
This is what a potential inflection zone looks like. It does not guarantee a trend reversal, but it does say that risk-reward for new shorts is deteriorating while aggressive countertrend longs are still betting against the dominant daily direction. In this context, traders watching the Uniswap price are effectively weighing continuation against a short-covering bounce.
Bullish scenario for UNI
For bulls, the setup is essentially a mean-reversion or relief rally bet inside a larger downtrend.
What the bullish path looks like:
1. Short-term hold above $3.85–3.90: This is the immediate support area, coinciding with daily S1 at $3.85 and the current pivot zone. Holding this band turns it into a short-term base rather than a staging point for another leg down.
2. Break and acceptance above $3.97–4.00: That is roughly daily R1 and a psychological level. A sustained push above there, ideally backed by rising 1H RSI and a positive 1H MACD cross, would confirm that intraday buyers are willing to chase rather than just defend.
3. First target: reversion toward the daily mid-Bollinger and EMA20 zone: A reasonable upside zone for a relief move sits around $4.60–4.70, with the daily middle band at $4.69 and EMA20 at $4.61. That is where the downtrend’s gravity should kick back in if the broader bear structure is still intact.
What would invalidate the bullish scenario:
– A clean breakdown below $3.85 on strong momentum, especially if daily RSI fails to bounce from oversold and starts to drift even lower. That would signal the market is not done liquidating and that oversold conditions are being resolved via time and price lower, not via a bounce.
– Failure to hold intraday EMAs on 1H and 15m, around the $3.90 area, with repeated rejections from $3.95–4.00 would also warn that bulls are too weak to even control the local range.
Bearish scenario for UNI
The bears still control the higher timeframe, and their thesis is simple: the trend is your friend until there is an actual reversal, not just oversold readings.
What continuation on the downside could look like:
1. Failure of the current base: Price slips back under the $3.90 pivot and loses $3.85 support. On the intraday charts, this would show up as 1H and 15m RSI rolling over from mid or high levels back toward 40 and below, with Bollinger Bands on those timeframes starting to expand downward.
2. Daily band walk lower: UNI starts closing at or below the daily lower Bollinger Band at $3.75 with no meaningful intraday bounces. That is the trend-grind behavior where oversold stays oversold and shorts keep pressing the move.
3. Further downside extension: Without exact structural levels below in this data, the broader idea is continuation of the medium-term downtrend as long as price remains well below the EMA20 and EMA50 region between $4.60 and $5.20. Each failed bounce into that band becomes another opportunity for sellers to reload.
What would invalidate the bearish scenario:
– A decisive reclaim and hold above the $4.60–4.70 zone, where the daily EMA20 and mid-Bollinger sit, turning that area into support on retests. At that point, the downtrend’s fast lane would be broken, and the market would begin transitioning toward a more balanced or even constructive structure.
– On the daily, MACD curling up toward a bullish cross and RSI climbing back above 40–45 with higher lows would indicate that selling pressure is no longer dominant.
Positioning, risk and uncertainty
UNI’s price action is a classic example of a trending market entering exhaustion territory. The daily chart says the path of least resistance is still down, but increasingly crowded. Intraday charts say the selling wave is pausing, not yet reversing. Moreover, the broader backdrop in late 2024, with Bitcoin dominance elevated and the fear and greed index at Extreme Fear (17), reinforces how sensitive altcoins are to swings in sentiment.
For anyone trading this, the core decisions revolve around time horizon and risk appetite:
– Trend followers will respect the bearish daily regime and likely look to fade rallies into resistance regions like $4.00–4.70, always with the awareness that oversold conditions can fuel violent squeezes.
– Mean-reversion traders will focus on the oversold daily RSI and early intraday stabilization, but they are effectively swimming against the current. Tight risk management and clearly defined invalidation below the $3.85 area are crucial for that style.
Volatility, with a daily ATR near 7% of price, is high enough that being wrong without a plan can become expensive quickly. The chart right now does not offer certainty; it offers a cleanly defined battleground between continuation and relief. How UNI behaves around $3.85–4.00 in the next sessions will tell you which side is actually getting the upper hand.
If you want to monitor markets with professional charting tools and real-time data, you can open an account on Investing using our partner link:
Open your Investing.com account
This section contains a sponsored affiliate link. We may earn a commission at no additional cost to you.
Disclaimer: This analysis is for informational and educational purposes only and is based solely on the provided market data. It is not investment, trading, or financial advice, and it does not consider your individual circumstances. Cryptoassets are highly volatile and can result in total loss of capital. Always conduct your own research and use appropriate risk management.
You May Also Like

Fed Decides On Interest Rates Today—Here’s What To Watch For

While Shiba Inu and Turbo Chase Price, 63% APY Staking Puts APEMARS at the Forefront of the Best Meme Coin Presale 2026 – Stage 6 Ends in 3 Days!