The post Bitcoin Price Faces Structural Pressure as Losses Spread Across On-Chain Holders appeared first on Coinpedia Fintech News Bitcoin price slipped below aThe post Bitcoin Price Faces Structural Pressure as Losses Spread Across On-Chain Holders appeared first on Coinpedia Fintech News Bitcoin price slipped below a

Bitcoin Price Faces Structural Pressure as Losses Spread Across On-Chain Holders

3 min read
Bitcoin Trend Cools After Spike to $98K Key BTC Price Levels to Watch Over the Next 48 Hours

The post Bitcoin Price Faces Structural Pressure as Losses Spread Across On-Chain Holders appeared first on Coinpedia Fintech News

Bitcoin price slipped below a critical volatility band near $83,000 in late January 2026, triggering renewed downside concern. At the same time, on-chain data shows losses spreading rapidly across holders, placing Bitcoin price behavior in a zone historically associated with heightened stress and late-stage corrections.

Bitcoin Price Breaks Below a Key Volatility Structure

From a technical perspective, Bitcoin price recently closed below the lower boundary of the Gaussian Channel on the weekly chart. This volatility-based indicator, built using statistical medians and standard deviations, has historically helped define trend strength during bull cycles.

When BTC price USD has slipped beneath this band in prior market expansions, it has often coincided with corrective phases rather than full trend reversals. That said, the current breakdown near the $83,000 region suggests weakening momentum rather than immediate capitulation.

Meanwhile, broader market conditions remain fragile. January’s volatility failed to reclaim key resistance levels, reinforcing the perception that Bitcoin price is consolidating under pressure rather than resetting for an immediate upside continuation.

Sentiment Deteriorates as Losses Dominate On-Chain

At the same time, sentiment indicators across social platforms have turned increasingly defensive. Community responses following the recent breakdown show growing expectations of deeper retracements, with downside levels being openly discussed rather than dismissed.

That said, sentiment alone rarely defines market bottoms. Instead, on-chain data provides a clearer picture of structural stress. One notable metric is the ratio comparing UTXOs in loss versus those in profit. This ratio has now fallen to levels typically associated with late correction phases or bear market environments.

Bitcoin Price Faces Structural Pressure as Losses Spread Across On-Chain Holders

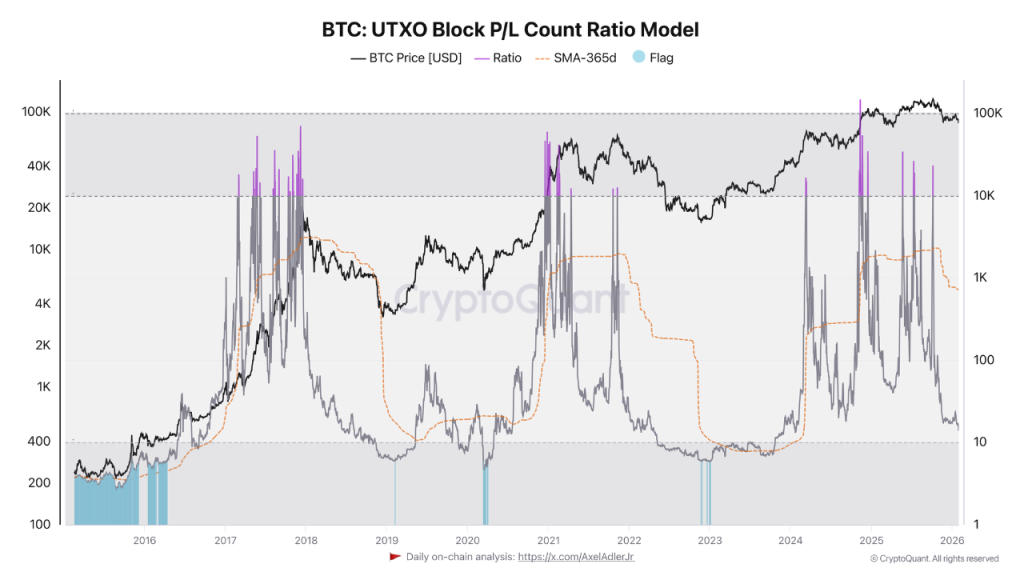
When profits dominate, elevated ratios often precede sell-offs as holders realize gains. Conversely, when losses become widespread, selling pressure tends to diminish not because confidence returns, but because fewer participants remain in profit.

UTXO Loss Ratios Signal Peak Stress Conditions

Still, the current environment reflects broad investor strain. Data shows a growing share of UTXOs slipping into unrealized loss, creating a negative feedback loop where fear replaces momentum. Historically, when this ratio approaches extreme lows, it has aligned with periods where downside risk begins to compress.

From an analytical standpoint, this does not imply immediate recovery. Rather, it highlights that Bitcoin price is entering a zone where forced selling often slows, even if volatility remains elevated. Short-term conditions remain bearish, but structurally, the market is approaching a region where pressure becomes asymmetrical.

The BTC price USD is therefore less driven by optimism and more by exhaustion dynamics, where sellers gradually lose dominance as losses spread.

Bitcoin Price Navigates a Compression Phase

In the current setup, Bitcoin price analysis reflects a convergence of technical weakness and on-chain stress rather than a single catalyst-driven move. The breakdown below volatility bands aligns with an environment where most participants are underwater, amplifying fear while simultaneously reducing incentive to sell aggressively.

From this angle, Bitcoin price behavior is increasingly shaped by compression rather than expansion. Whether this phase resolves through further downside or stabilization will depend on how quickly loss dominance peaks and volatility contracts.

Disclaimer: The articles reposted on this site are sourced from public platforms and are provided for informational purposes only. They do not necessarily reflect the views of MEXC. All rights remain with the original authors. If you believe any content infringes on third-party rights, please contact service@support.mexc.com for removal. MEXC makes no guarantees regarding the accuracy, completeness, or timeliness of the content and is not responsible for any actions taken based on the information provided. The content does not constitute financial, legal, or other professional advice, nor should it be considered a recommendation or endorsement by MEXC.

You May Also Like

Top Altcoins To Hold Before 2026 For Maximum ROI – One Is Under $1!

Top Altcoins To Hold Before 2026 For Maximum ROI – One Is Under $1!

BlockchainFX presale surges past $7.5M at $0.024 per token with 500x ROI potential, staking rewards, and BLOCK30 bonus still live — top altcoin to hold before 2026.
Share
Blockchainreporter2025/09/18 01:16
UBS CEO Targets Direct Crypto Access With “Fast Follower” Tokenization Strategy

UBS CEO Targets Direct Crypto Access With “Fast Follower” Tokenization Strategy

The tension in UBS’s latest strategy update is not between profit and innovation, but between speed and control. On February 4, 2026, as the bank reported a record
Share
Ethnews2026/02/05 04:56
Cryptos Signal Divergence Ahead of Fed Rate Decision

Cryptos Signal Divergence Ahead of Fed Rate Decision

The post Cryptos Signal Divergence Ahead of Fed Rate Decision appeared on BitcoinEthereumNews.com. Crypto assets send conflicting signals ahead of the Federal Reserve’s September rate decision. On-chain data reveals a clear decrease in Bitcoin and Ethereum flowing into centralized exchanges, but a sharp increase in altcoin inflows. The findings come from a Tuesday report by CryptoQuant, an on-chain data platform. The firm’s data shows a stark divergence in coin volume, which has been observed in movements onto centralized exchanges over the past few weeks. Bitcoin and Ethereum Inflows Drop to Multi-Month Lows Sponsored Sponsored Bitcoin has seen a dramatic drop in exchange inflows, with the 7-day moving average plummeting to 25,000 BTC, its lowest level in over a year. The average deposit per transaction has fallen to 0.57 BTC as of September. This suggests that smaller retail investors, rather than large-scale whales, are responsible for the recent cash-outs. Ethereum is showing a similar trend, with its daily exchange inflows decreasing to a two-month low. CryptoQuant reported that the 7-day moving average for ETH deposits on exchanges is around 783,000 ETH, the lowest in two months. Other Altcoins See Renewed Selling Pressure In contrast, other altcoin deposit activity on exchanges has surged. The number of altcoin deposit transactions on centralized exchanges was quite steady in May and June of this year, maintaining a 7-day moving average of about 20,000 to 30,000. Recently, however, that figure has jumped to 55,000 transactions. Altcoins: Exchange Inflow Transaction Count. Source: CryptoQuant CryptoQuant projects that altcoins, given their increased inflow activity, could face relatively higher selling pressure compared to BTC and ETH. Meanwhile, the balance of stablecoins on exchanges—a key indicator of potential buying pressure—has increased significantly. The report notes that the exchange USDT balance, around $273 million in April, grew to $379 million by August 31, marking a new yearly high. CryptoQuant interprets this surge as a reflection of…
Share
BitcoinEthereumNews2025/09/18 01:01