

Pi Network Price Attempts Recovery After Major Mainnet Migration Update

The post Pi Network Price Attempts Recovery After Major Mainnet Migration Update appeared first on Coinpedia Fintech News
Pi Network price is showing early signs of stabilization after an extended decline, as fresh progress on mainnet migration shifts market attention back to fundamentals. While broader crypto market sentiment remains cautious, Pi’s latest update has sparked renewed interest among holders who had been waiting for clarity on network access and usability. The move is not a breakout yet. Still, it marks a shift in tone from persistent weakness to cautious recovery raising a key question for the market: Is Pi price building a base, or merely staging a short-lived bounce?
Mainnet Migration Update Brings Long-Awaited Clarity
Pi Network has taken a major step toward broader on-chain participation after unblocking mainnet migration access for approximately 2.5 million previously restricted users. The update raises the total number of users eligible to migrate to around 16 million, marking one of the largest verified onboarding efforts among consumer-focused blockchain networks.
The migration process remains gated by Know-Your-Customer (KYC) requirements and a structured mainnet checklist, ensuring that only verified balances transition to the live blockchain. According to the project, this phased expansion follows backend optimizations aimed at easing congestion and improving verification throughput.
Beyond the current batch, the network is also preparing to migrate an additional around 700,000 users in upcoming phases, signaling that Pi’s enclosed ecosystem is gradually transitioning toward a more functional on-chain economy.
Importantly, this expansion is not merely symbolic, it directly affects how Pi tokens can be used, transferred, and eventually priced by the market.
From a fundamentals perspective, expanding mainnet access reduces long-standing concerns around token accessibility and delayed utility, two factors that have weighed heavily on PI price sentiment in recent months.
PI Price Action Shows Signs of Base Formation
PI price action is beginning to show early signs of stabilization after an extended downtrend. The token has been trading within a clearly defined demand zone, where selling pressure has repeatedly failed to push price to new lows. The chart structure highlights a shift from aggressive downside momentum to sideways compression, often seen during base-building phases. Now, PI network price has started printing higher intraday swings, suggesting that sellers are losing control, even though broader market participation remains cautious.
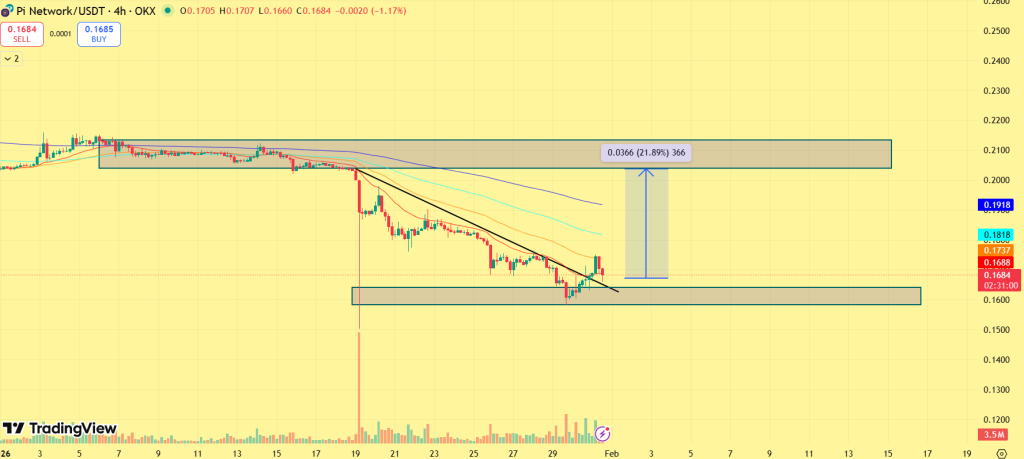
Looking at the short-term charts, the token has broken its downtrend and marked a fresh higher high swing, which displays signs of reversal. In case of further recovery, Pi price may surge 22% toward a well-defined resistance zone near $0.2000. A decisive break above this zone, accompanied by sustained volume, would be required to confirm a trend reversal. Until then, the move remains a recovery attempt, not a confirmed bullish breakout.
Final Thoughts
Pi Network’s latest migration expansion meaningfully strengthens its fundamental narrative, bringing millions of users closer to full on-chain participation. This reduces uncertainty around token usability and supports the idea that Pi network is transitioning from a closed ecosystem toward a functional blockchain economy. That said, price action suggests the market is still in a wait-and-see phase. While the demand zone is holding and downside momentum has slowed, Pi network must reclaim key resistance levels to shift sentiment decisively bullish.
You May Also Like

Securities Fraud Investigation Into Corcept Therapeutics Incorporated (CORT) Announced – Shareholders Who Lost Money Urged To Contact Glancy Prongay Wolke & Rotter LLP, a Leading Securities Fraud Law Firm

Microsoft Corp. $MSFT blue box area offers a buying opportunity
