

How high can a Shiba Inu go realistically? Market-cap math for SHIB
Use this as a starting point to test conservative, moderate, and optimistic scenarios before you buy shiba inu coin. The guide points to primary sources for live supply checks and gives a short checklist you can apply to your own model.
If you want to buy shiba inu coin, a quick reality check
If you plan to buy shiba inu coin, start with one clear fact: the circulating supply is the number that turns any assumed market cap into a per-token price. Major public trackers report SHIB circulating supply near 589 trillion tokens, which is the core input for price math and for any realistic target CoinMarketCap Shiba Inu page.
The valuation formula you will use repeatedly is price equals market cap divided by circulating supply. That simple equation is why tiny per-token prices can still mean enormous total market caps when supply is very large Investopedia market-cap definition.
Advertise with FinancePolice to reach readers testing crypto topics
If you plan to model outcomes, run the checklist below with live supply numbers and conservative market-cap assumptions before you buy.
Learn about FinancePolice advertising
To be concrete, per-token targets like $0.01 or $1 are not just optimistic, they imply market caps that are orders of magnitude larger than most single public assets. For example, a $0.01 SHIB price would imply a multi-trillion dollar market cap at current supply levels, a scale worth questioning before any purchase Etherscan token tracker.
This opening reality check sets expectations. For data on current supply and market metrics see CoinMarketCap, which collects live figures used in the math.
How SHIB supply and market cap determine price
Public sources report SHIB supply numbers that you should use as inputs. CoinMarketCap and Etherscan publish circulating supply figures that are publicly accessible and can differ slightly by tracker; for modeling, pick one live source and document it CoinMarketCap Shiba Inu page.
The conversion itself is straightforward. Use price = market cap ÷ circulating supply. For example, if you assume a $1 trillion market cap, dividing that by roughly 589 trillion tokens implies a per-token price close to $0.0017. Label each number when you write it down so you avoid transcription errors Investopedia market-cap definition.
Keep the math visible. Small-looking token prices can still represent very large total values because the denominator is large. That is the main reason headline per-token numbers can be misleading unless you also state the assumed market-cap figure.

To calculate ceilings, first pick market-cap scenarios you consider plausible. Common scenario bands are conservative, moderate, and optimistic. Document why each band is plausible for you, for example by comparing to the total market caps of established cryptos or public companies.
How to calculate realistic SHIB price ceilings
Next, convert your market-cap assumption to a per-token price using the market-cap formula. For example, using the current circulating supply, $1 trillion ÷ ~589 trillion ≈ $0.0017. That numeric example shows how even a trillion-dollar market cap yields only a fractional-cent SHIB price when supply is very large CoinMarketCap Shiba Inu page.
Using current circulating supply and the formula price = market cap ÷ circulating supply, realistic per-token ceilings depend on what total market cap you consider plausible; moderate assumptions still imply fractional-cent prices unless supply is dramatically reduced or market cap expands by multiple orders of magnitude.
After the quick calculation, repeat it across your other scenarios. Try halving and doubling market-cap assumptions to see how sensitive the per-token price is to your input choices and to any hypothetical supply changes. You can cross-check on-chain balances with the Etherscan token tracker Etherscan token tracker as you iterate.
How SHIB supply and market cap determine price
Where the supply numbers come from matters for live checks. CoinMarketCap aggregates exchange-reported and on-chain data, while Etherscan reads on-chain balances directly for Ethereum-based tokens; both are useful cross-checks when you build a model Etherscan token tracker.
When you apply the market-cap math, label every number and keep units consistent. If you use dollars for market cap, the calculated price will be dollars per token. Simple, labeled arithmetic reduces mistakes and supports easier scenario comparisons Investopedia market-cap definition.
How to calculate realistic SHIB price ceilings
Pick plausible market-cap scenarios by comparing to other crypto market caps and global assets. Conservative scenarios assume SHIB stays a niche meme token with modest new adoption. Moderate scenarios assume wider retail interest and some utility. Optimistic scenarios assume broad adoption or structural supply reductions.
Convert each scenario into a per-token price using the formula. For example, a $1 trillion market cap with ~589 trillion supply gives about $0.0017 per token, the arithmetic is market cap divided by supply CoinMarketCap Shiba Inu page. Keep assumptions explicit so you can re-run the math as conditions change and consult our crypto category for related coverage.
Benchmarks: what SHIB would look like at Bitcoin-level market caps
Benchmarks help make targets concrete. Bitcoin has had market caps in the hundreds of billions to over a trillion dollars; if SHIB reached a similar market-cap level, the implied per-token price would still be small because of high supply. For example, a Bitcoin-scale cap produces a fractional-cent SHIB price rather than dollar-level prices CoinMarketCap Bitcoin page.
This comparison explains why common headline targets like $0.01 or $1 per SHIB imply market caps that are much larger than most single public assets. That gap is the reason many analysts treat those targets as implausible without major supply or demand shifts.
Tokenomics levers that can change supply or demand
Tokenomics levers can influence outcomes, but their practical limits matter. Periodic burns reduce circulating supply and therefore raise the implied per-token price for a given market cap, but burns have to be very large to move per-token decimals materially when supply is in the hundreds of trillions CoinDesk guide to Shiba Inu.
Efforts like Shibarium aim to create more utility, which can increase demand if adoption follows. Utility and adoption can change the demand side of the market-cap equation, but adoption is uncertain and typically takes time to translate into sustained market-cap expansion CoinDesk guide to Shiba Inu.
Large-holder concentration also matters because a few wallets can amplify price moves when they buy or sell. That concentration increases volatility and execution risk for large trades, which is a separate modeling factor from supply totals Etherscan token tracker.
Event-driven spikes versus sustained value: what history shows
SHIB has experienced episodic rallies tied to news, burns, and ecosystem events. Those spikes demonstrate that tokenomics and publicity can move price in the short term, but spikes often fade without structural changes that support lasting demand CoinDesk guide to Shiba Inu. For context on how retail interest and influencers affect short-term moves see coverage of crypto influencers.
For modeling, treat event-driven spikes as short-term shocks. When you calculate long-term ceilings, separate temporary demand shocks from sustained market-cap increases to avoid overstating realistic long-run prices. Useful background on Etherscan balances is available at the token tracker Etherscan token tracker.
Practical scenarios: conservative, moderate, optimistic
To make the idea actionable, label three scenarios with clear market-cap assumptions and convert each to per-token prices using current supply. Keep assumptions explicit so you can re-run the math as conditions change CoinMarketCap Shiba Inu page.
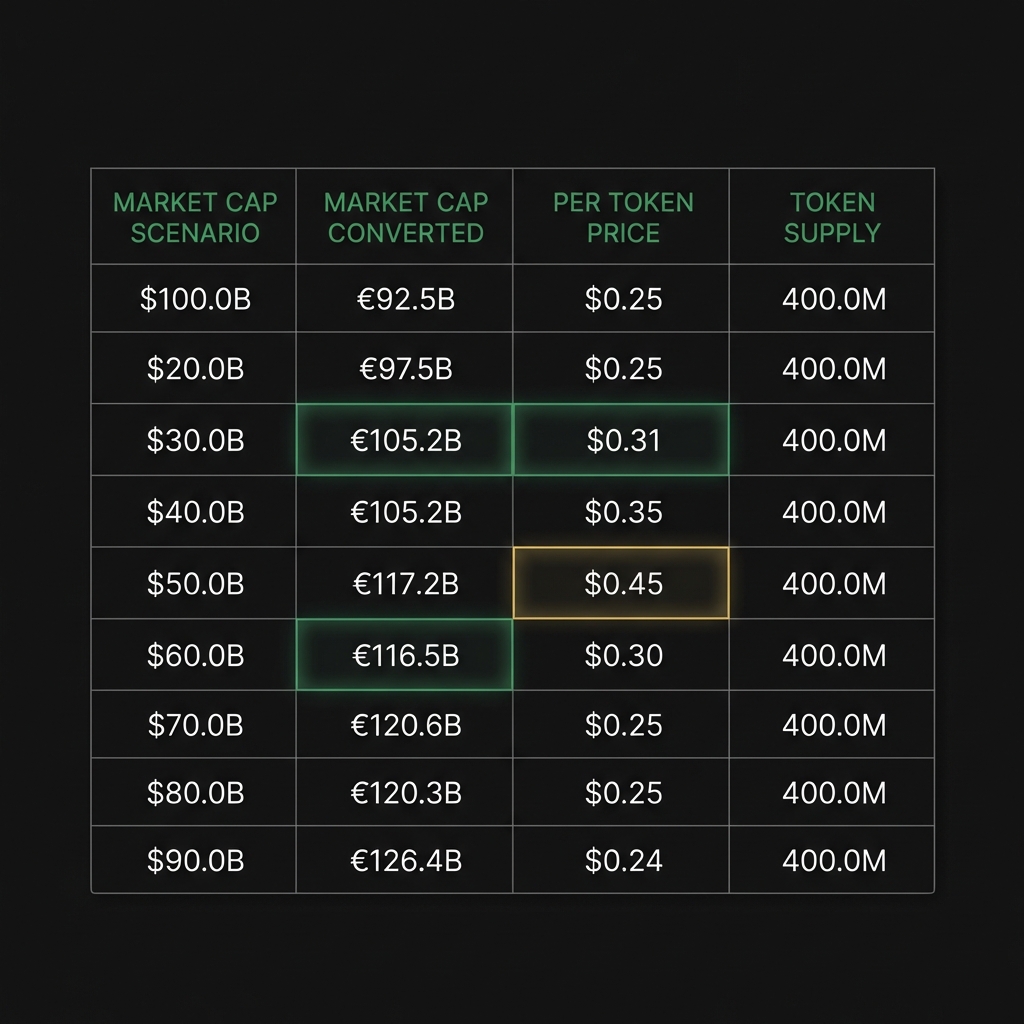
quick conversion of market cap and supply to price per token
–
USD
use consistent units
Example scenario numbers you can test in a spreadsheet: conservative $10 billion market cap, moderate $100 billion, optimistic $500 billion. Using the circulating supply near 589 trillion, convert each market cap to an implied price and label the results clearly.
State your confidence level for each scenario. Conservative results typically carry higher confidence because they rely on smaller changes from the status quo. Optimistic cases require more structural change and therefore warrant lower confidence labels.
How to build your own SHIB price model step-by-step
Follow a short checklist: 1) record live circulating supply from a primary source, 2) pick a set of market-cap scenarios and justify each, 3) calculate per-token prices using market cap divided by supply, 4) test sensitivity by changing supply and market caps, and 5) document assumptions and revisit them periodically Etherscan token tracker.
For sensitivity checks, try halving the supply or doubling the market cap to see directional impacts. These simple tweaks show which inputs most influence your implied price and help avoid over-committing to a single scenario Investopedia market-cap definition.
Common mistakes when estimating SHIB targets
One frequent error is ignoring the magnitude of supply. Forgetting that circulating supply is in the hundreds of trillions leads to headline prices that do not say what market-cap would be required to reach them CoinMarketCap Shiba Inu page.
Other mistakes include assuming rapid, sustained adoption without evidence and ignoring the pace at which burns actually happen. Always test a reasonable burn pace separately from demand expansion because burns alone do not create buyers in the market CoinDesk guide to Shiba Inu.
Risk and allocation: should SHIB be in your portfolio?
SHIB is a high-risk, speculative exposure. If you consider buy shiba inu coin, tie any position size to your risk tolerance and time horizon, and treat it as speculative rather than core allocation. Small position sizes and strict limits help manage downside risk. See practical strategies to reduce risk in cryptocurrency investments.
Use diversification and time horizon to guide allocation. For many readers, a small speculative slice rather than a large allocation keeps potential volatility manageable while preserving capital for long-term goals.
How token burns would change the math
Burns reduce circulating supply and therefore raise the implied per-token price for a given market cap. For example, a 1% burn reduces supply modestly and has a small effect on per-token price, while a 50% burn would double the implied price for a stable market cap. Run the arithmetic yourself to see the scale of change required Etherscan token tracker.
Practical limits apply. Sustaining very large burns requires a continuous supply of tokens to remove or a structural change in token issuance mechanics. Burns change the supply side but do not by themselves create demand, which is still necessary for market-cap expansion CoinDesk guide to Shiba Inu.
How on-chain concentration affects price moves
Large wallets hold a substantial share of many meme tokens, and SHIB is no exception. When a few addresses hold large percentages of supply, their trades can move price sharply, which increases volatility and execution risk for large buyers or sellers Etherscan token tracker.
Before committing a sizable position, check on-chain distribution data and consider how much liquidity you would need to buy or sell without moving the market too much. That practical check belongs in the same model where you compute implied prices.
If you still want to buy shiba inu coin, a practical buying checklist
Pre-purchase checks: verify live circulating supply on a primary source, estimate slippage and fees on your chosen execution path, set a position size tied to a risk budget, and document the market-cap scenarios that would make your entry sensible Etherscan token tracker.
Execution and post-purchase steps: execute small test trades to estimate slippage, confirm on-chain addresses and wallet security, and set a schedule to revisit your model assumptions at regular intervals or after major events.
Summary: realistic expectations and next steps
Summary: realistic expectations and next steps
Market-cap math shows that supply and market cap are the primary drivers of any realistic SHIB price ceiling. Use price = market cap ÷ circulating supply as your starting point and test conservative and optimistic market-cap assumptions instead of relying on headline per-token targets Investopedia market-cap definition.
As a practical takeaway, model a range of market caps and test sensitivity to burns and adoption. If you decide to buy shiba inu coin, keep positions small relative to your portfolio, document assumptions, and verify live supply numbers before executing trades CoinMarketCap Shiba Inu page.
The primary factor is the circulating supply combined with the token's total market cap; price equals market cap divided by circulating supply.
No. Burns reduce supply, but very large burns are required to move per-token decimals meaningfully and burns alone do not create the sustained demand needed for dollar-level prices.
Use primary on-chain trackers and market aggregators such as Etherscan and CoinMarketCap to verify the current circulating supply and related metrics.
FinancePolice provides tools and checklists to help readers think through decisions, but this material is educational and not investment advice.
References
- https://coinmarketcap.com/currencies/shiba-inu/
- https://www.investopedia.com/terms/m/marketcapitalization.asp
- https://etherscan.io/token/0x95aD61b0a150d79219dCF64E1E6Cc01f0B64C4cE
- https://financepolice.com/advertise/
- https://www.coindesk.com/learn/what-is-shiba-inu/
- https://coinmarketcap.com/currencies/bitcoin/
- https://financepolice.com/category/crypto/
- https://financepolice.com/strategies-to-reduce-risk-in-cryptocurrency-investments-through-diversification-in-2025/
- https://financepolice.com/crypto-influencers-and-their-role-in-stimulating-retail-interest/
You May Also Like

Over 60% of crypto press releases linked to high-risk or scam projects: Report

ArtGis Finance Partners with MetaXR to Expand its DeFi Offerings in the Metaverse
