

Bitcoin Drops $4,000 As EU-US Trade War Wipes $110 Billion From Crypto Market
Bitcoin price fell almost $4,000 as Europe hinted at retaliatory measures against US President Donald Trump, who threatened new trade tariffs unless negotiations could begin over Greenland.
The BTC drop came as the trade war also wiped out about $110 billion, sending BTC down by over 2.5% to a market capitalization of $3.22 trillion.
Bitcoin prices dumped 2.5% in the last 24 hours, dropping to below $92,000. BTC is now trading at $92,440 as of 1:16 a.m. EST, according to a Coinbase chart on TradingView.
EU–US Trade War Shakes the Crypto Market
As a result of the crypto market wiping over $110 billion in the last 24 hours, around $787 million in long positions were liquidated in the last day, bringing the total 24-hour liquidations to over $870 million, according to Coinglass data. Over $223 million was BTC-related long positions.
The drop comes after US President Donald Trump revived global fears of trade tariffs by imposing duties on several major European nations over Greenland.
Trump had earlier threatened to impose up to 25% tariffs on several European countries, stating that the duties would remain in place until a deal to sell Greenland to the United States was reached.
However, European nations have continuously rejected Trump’s demand for the Danish territory, with France also seen preparing retaliatory economic measures against Washington.
Trump has repeatedly demanded that Greenland be ceded to the U.S., claiming that the island is of great importance to U.S. national security.
Following the refusal to sell Greenland, Trump said that Denmark has been unable to stave off a Russian threat from Greenland.
“NATO has been telling Denmark, for 20 years, that ‘you have to get the Russian threat away from Greenland…’ Denmark has been unable to do anything about it,” Trump said. “Now it is time, and it will be done.”
Gold futures soared to record highs of $4,680 per ounce as markets reacted to the resumption of the US-EU trade war, according to Google Finance. Silver futures also skyrocketed above $93 per ounce for the first time in history.
Bitcoin Price Pull Backs As Selling Pressure Intensifies
After breaking above the ascending triangle and rallying to over $97,000, the BTC price has since faced selling pressure at this resistance level.
This has resulted in the Bitcoin price dropping back into the triangle, now trading around the upper boundary of the pattern and the 20-day Exponential Moving Average (EMA).
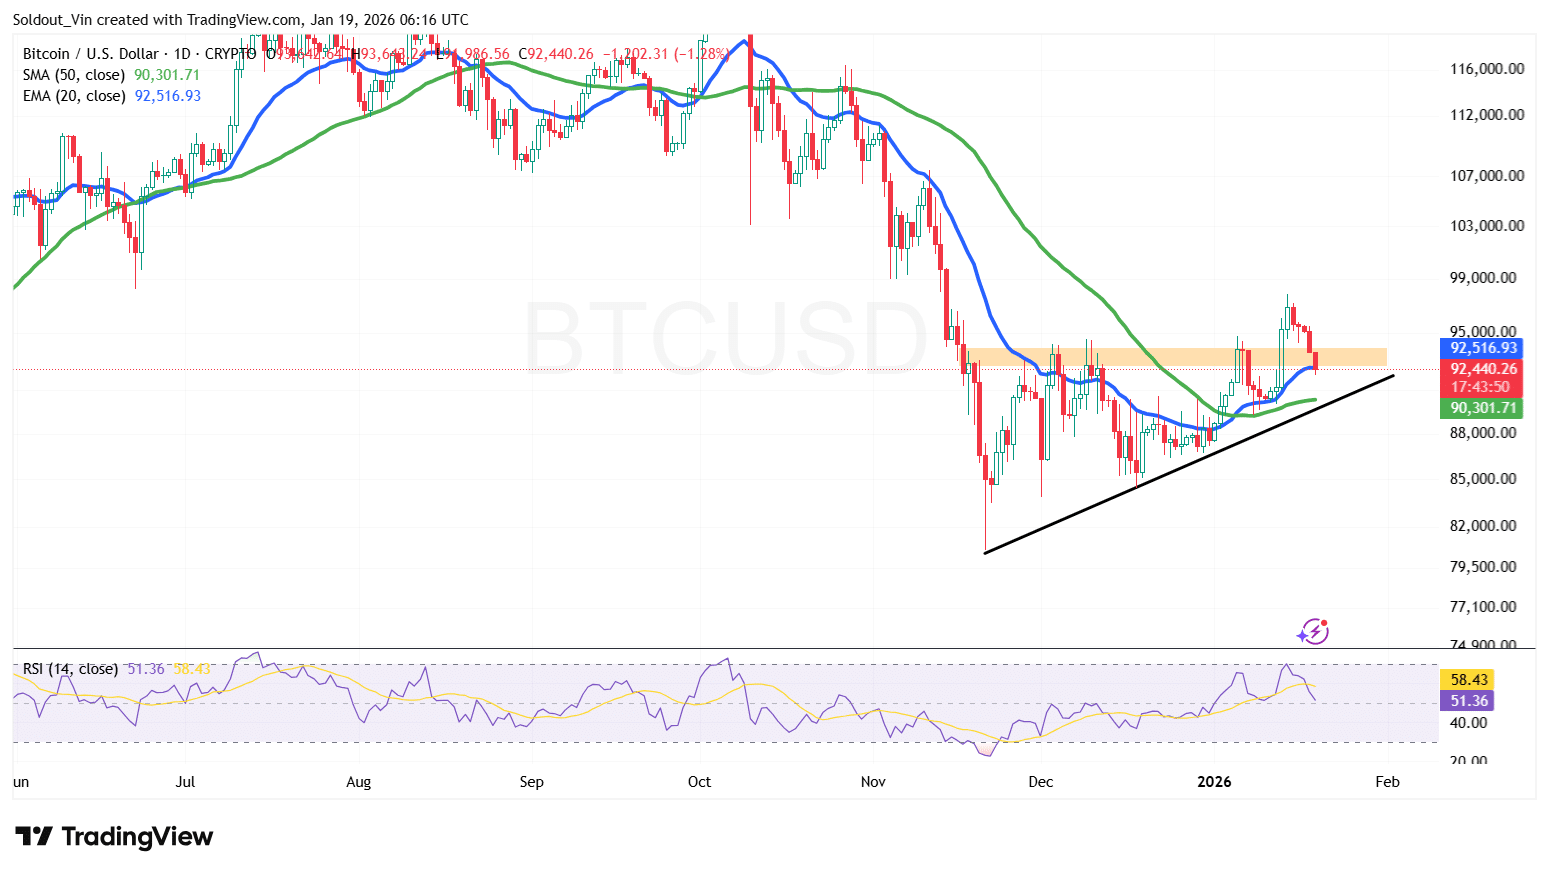 BTC/USD Chart Analysis Source: TradingView
To add to the bearish pressure, the Relative Strength has dropped from around 68 to 51.36 and is still plunging, indicating sustained selling pressure in the Bitcoin market.
BTC Price Outlook: Is The Drop A Warning Sign?
As a result of the trade war, the cryptocurrency market, especially Bitcoin, is experiencing a sustained drop as traders run to safe-haven assets.
According to the BTC/USD Chart analysis, the Bitcoin price is still trading above the 50-day Simple Moving Average (SMA), which is providing strong short-term support at $90,301.
With trade threats looming as BTC tries to hold above $90,000 over the last two weeks, Bitcoin could yet drop further. If Bitcoin’s price continues to drop and breaches the 50-day SMA, the asset risks a drop to the lower boundary around $89,000.
However, institutional buying could be a positive factor in holding the price above this support. Michael Saylor has hinted that Strategy will soon make another BTC purchase, as it pushes to hold over 3% of the asset’s total supply.
Saylor posted “Bigger Orange” on X, a phrase he has used before announcing new Bitcoin buys.
After buying 13,627 BTC last week, Strategy now holds 687,410 BTC acquired for $51.8 billion at $75,353 per Bitcoin.
Related News:
You May Also Like

Securities Fraud Investigation Into Corcept Therapeutics Incorporated (CORT) Announced – Shareholders Who Lost Money Urged To Contact Glancy Prongay Wolke & Rotter LLP, a Leading Securities Fraud Law Firm

Microsoft Corp. $MSFT blue box area offers a buying opportunity
