Solana (SOL) ticks marginally higher on Tuesday as the selling pressure persists following the near 2% drop on Monday. The technical outlook indicates mixed signals as the trend momentum subsides while SOL stands at a crucial crossroads.Solana (SOL) ticks marginally higher on Tuesday as the selling pressure persists following the near 2% drop on Monday. The technical outlook indicates mixed signals as the trend momentum subsides while SOL stands at a crucial crossroads.

Solana Price Forecast: SOL eyes breakout as network activity hits record high, ETF chances improve

3 min read
  • Solana holds steady following the near 2% drop on Monday, unaffected by the increasing number of positive catalysts.
  • The daily active addresses on Solana hit a record high of 15.39 million, suggesting increased network activity.
  • The US SEC requests amendments from potential issuers before the end of July, sparking interest in the Solana ETF approval.  

Solana (SOL) ticks marginally higher on Tuesday as the selling pressure persists following the near 2% drop on Monday. The technical outlook indicates mixed signals as the trend momentum subsides while SOL stands at a crucial crossroads. 

The US Securities and Exchange Commission (SEC) has asked potential Solana Exchange-Traded Fund (ETF) issuers to amend or refile applications by the end of July, boosting approval anticipation among investors. Concurrent with the heightened optimism, the daily active addresses on the Solana network reached a record high, which could catalyze a breakout rally. 

US SEC requests Solana ETF issuers for amendments

The US SEC plans to create a framework to streamline the approval process of crypto-focused ETFs. Amid the growing buzz about an upcoming framework, the SEC has ordered SOL ETF issuers to amend and refile their submissions by the end of July. This move fuels speculation about a potential SOL ETF approval from the SEC before the final deadline of October 10. 

James Seyffart, Bloomberg’s ETF analyst, views the request as a positive sign from the regulators while anticipating further back-and-forth on amendments rather than a direct approval. 

Solana network activity sparks overnight 

The Daily Active Addresses (DAA) indicator refers to the unique addresses that are active on a network in a day. A surge in DAA translates to increased users, which boosts network activity and could lead to higher demand for its native token, required for transaction fees, Decentralized Finance (DeFi) services, and other applications. 

Santiment’s data shows Solana’s DAA reaching a record high of 15.39 million addresses on Monday. The DAA surge reflects increased user activity on the network, which comes on the back of increased ETF approval chances and could translate to increased spot demand for SOL. 

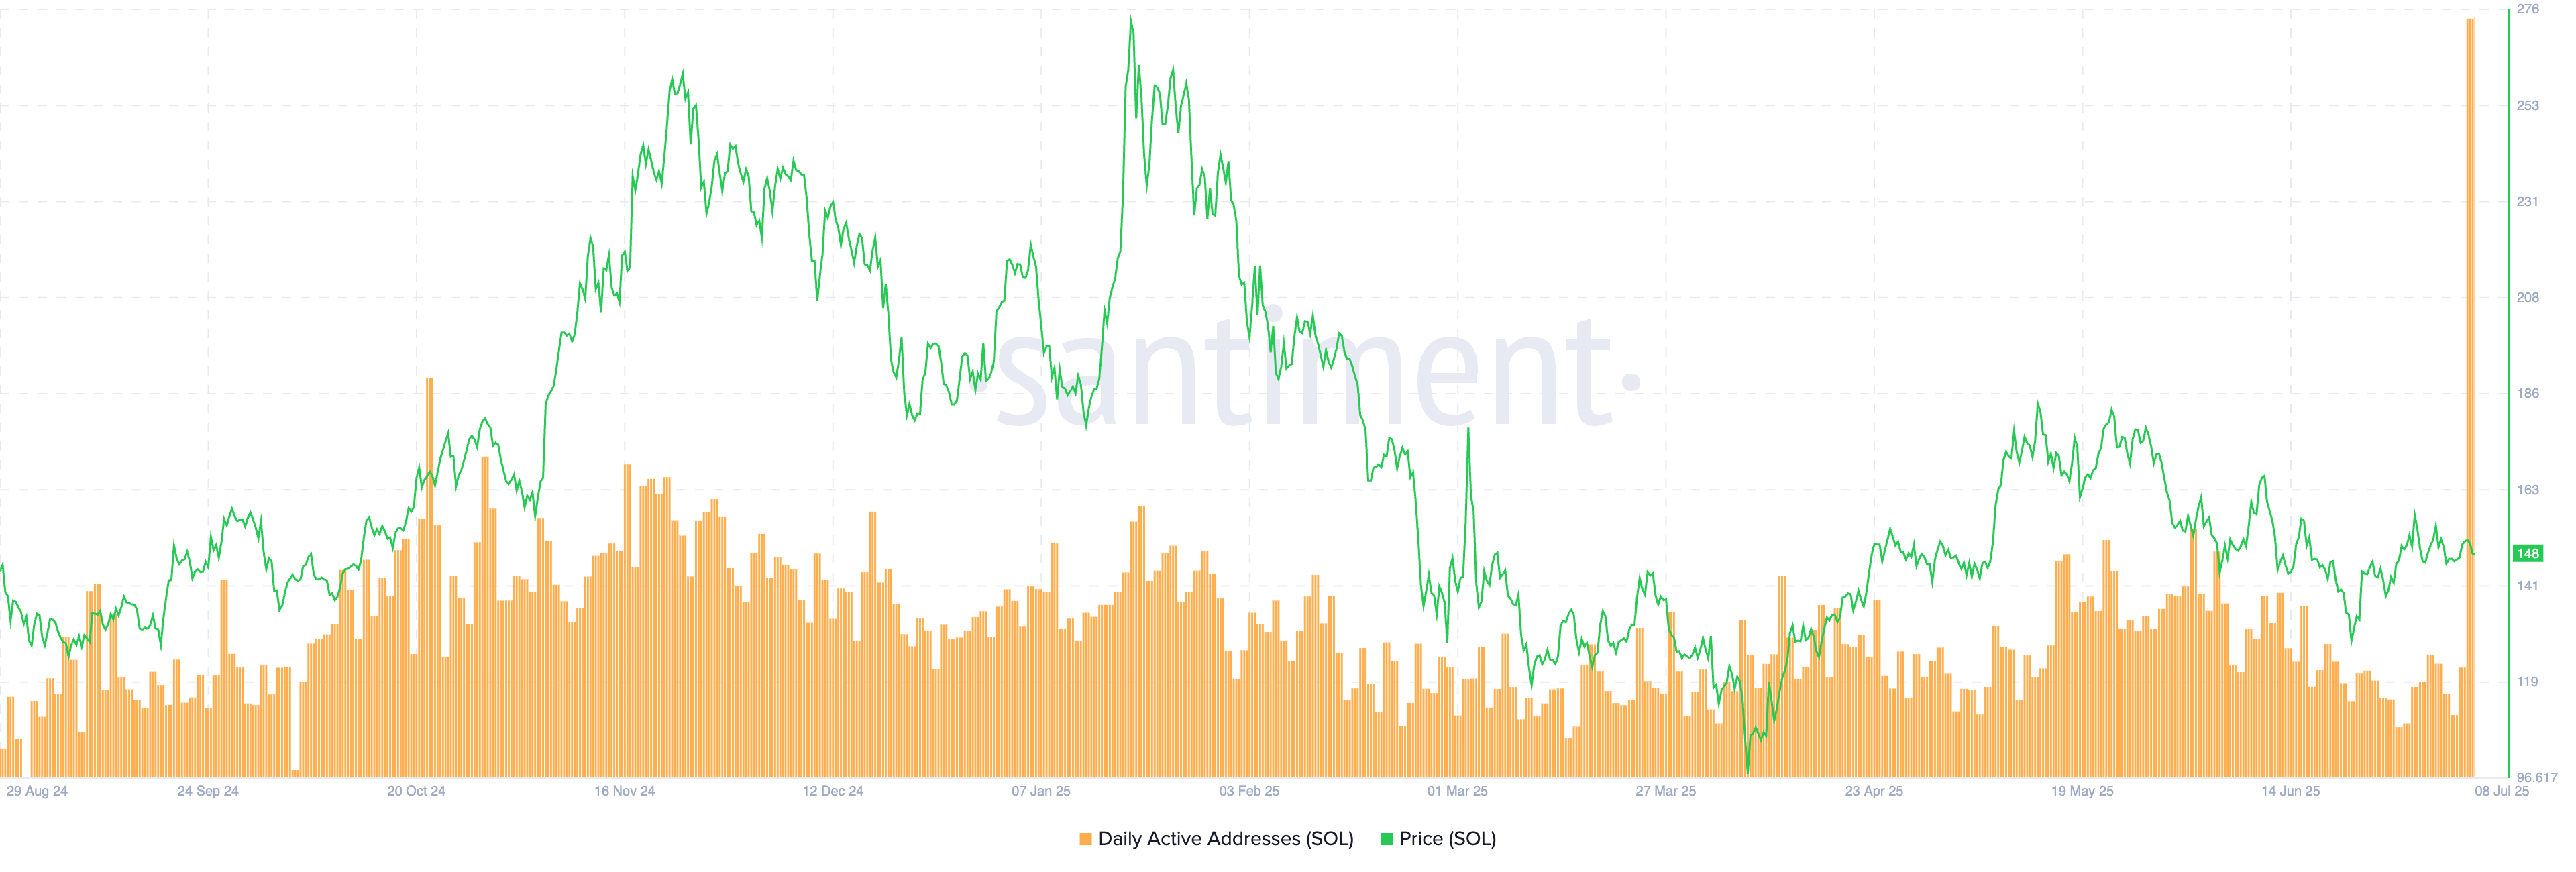
Solana's daily active addresses. Source: Santiment

Lack of momentum in Solana delays trendline breakout 

Solana hovers below a six-month resistance trendline retraced from the close of January 18 and the highs of May 22 and June 11. At the time of writing, SOL edges higher by nearly 0.50% following the 1.96% pullback on Monday. 

As Solana hovers close to the overhead trendline, it floats above the 23.6% Fibonacci retracement level at $142, drawn from the $295 all-time high on January 19 to the $95 low on April 7. A potential daily close above the trendline at $151 could ignite a trend reversal in Solana.

Still, a decisive push above the Supertrend indicator line and the 200-day Exponential Moving Average, which are near $159, could provide a stronger trend reversal sign. In such a case, the 50% Fibonacci level at $195 could be the immediate price target.

The Moving Average Convergence/Divergence (MACD) indicator shows the MACD and signal line close to crossing above the zero line. However, the declining histogram bars suggest a crossover risk, a sell signal. 

The Relative Strength Index (RSI) is hovering near the midpoint of 50, indicating indecision among investors. 

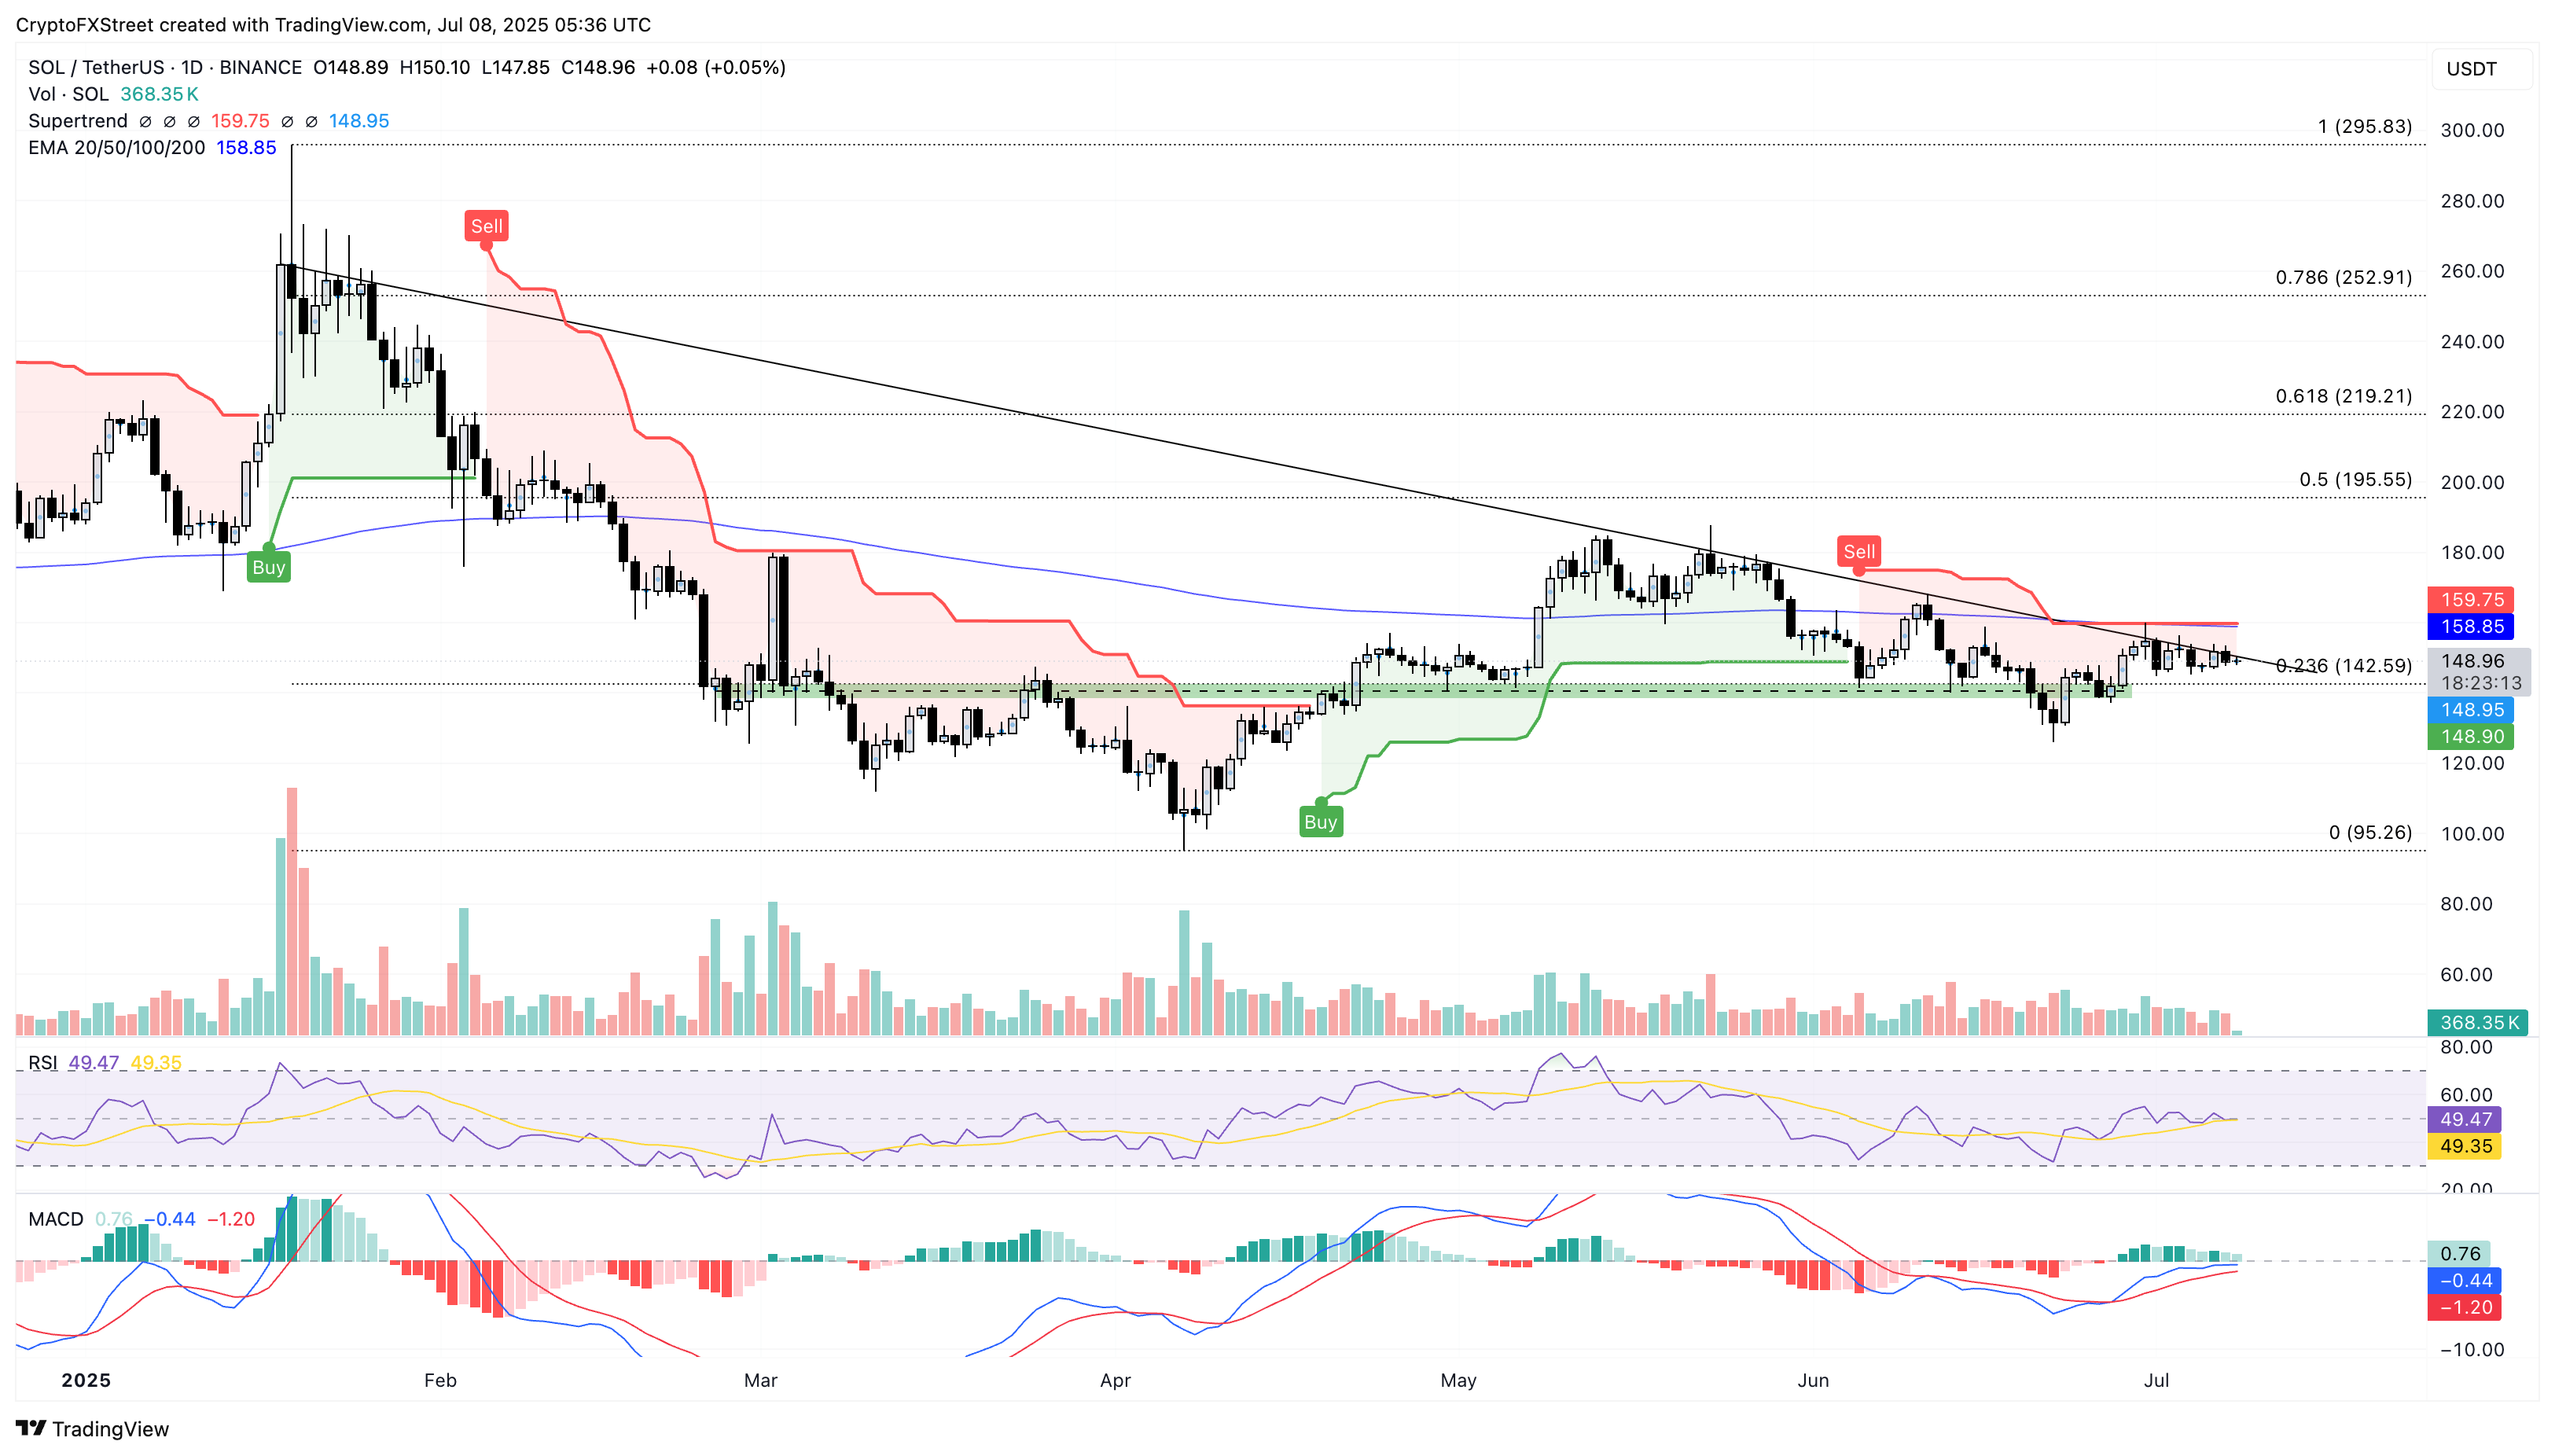
SOL/USDT daily price chart.

If Solana closes below the 23.6% Fibonacci level at $142, it could decline closer to the $100 psychological support level. 


Market Opportunity
NEAR Logo
NEAR Price(NEAR)
$1.189
$1.189$1.189
-1.40%
USD
NEAR (NEAR) Live Price Chart
Disclaimer: The articles reposted on this site are sourced from public platforms and are provided for informational purposes only. They do not necessarily reflect the views of MEXC. All rights remain with the original authors. If you believe any content infringes on third-party rights, please contact service@support.mexc.com for removal. MEXC makes no guarantees regarding the accuracy, completeness, or timeliness of the content and is not responsible for any actions taken based on the information provided. The content does not constitute financial, legal, or other professional advice, nor should it be considered a recommendation or endorsement by MEXC.

You May Also Like

Egrag Crypto: XRP Could be Around $6 or $7 by Mid-November Based on this Analysis

Egrag Crypto: XRP Could be Around $6 or $7 by Mid-November Based on this Analysis

Egrag Crypto forecasts XRP reaching $6 to $7 by November. Fractal pattern analysis suggests a significant XRP price surge soon. XRP poised for potential growth based on historical price patterns. The cryptocurrency community is abuzz after renowned analyst Egrag Crypto shared an analysis suggesting that XRP could reach $6 to $7 by mid-November. This prediction is based on the study of a fractal pattern observed in XRP’s past price movements, which the analyst believes is likely to repeat itself in the coming months. According to Egrag Crypto, the analysis hinges on fractal patterns, which are used in technical analysis to identify recurring market behavior. Using the past price charts of XRP, the expert has found a certain fractal that looks similar to the existing market structure. The trend indicates that XRP will soon experience a great increase in price, and the asset will probably reach the $6 or $7 range in mid-November. The chart shared by Egrag Crypto points to a rising trend line with several Fibonacci levels pointing to key support and resistance zones. This technical structure, along with the fractal pattern, is the foundation of the price forecast. As XRP continues to follow the predicted trajectory, the analyst sees a strong possibility of it reaching new highs, especially if the fractal behaves as expected. Also Read: Why XRP Price Remains Stagnant Despite Fed Rate Cut #XRP – A Potential Similar Set-Up! I've been analyzing the yellow fractal from a previous setup and trying to fit it into various formations. Based on the fractal formation analysis, it suggests that by mid-November, #XRP could be around $6 to $7! Fractals can indeed be… pic.twitter.com/HmIlK77Lrr — EGRAG CRYPTO (@egragcrypto) September 18, 2025 Fractal Analysis: The Key to XRP’s Potential Surge Fractals are a popular tool for market analysis, as they can reveal trends and potential price movements by identifying patterns in historical data. Egrag Crypto’s focus on a yellow fractal pattern in XRP’s price charts is central to the current forecast. Having contrasted the market scenario at the current period and how it was at an earlier time, the analyst has indicated that XRP might revert to the same price scenario that occurred at a later cycle in the past. Egrag Crypto’s forecast of $6 to $7 is based not just on the fractal pattern but also on broader market trends and technical indicators. The Fibonacci retracements and extensions will also give more insight into the price levels that are likely to be experienced in the coming few weeks. With mid-November in sight, XRP investors and traders will be keeping a close eye on the market to see if Egrag Crypto’s analysis is true. If the price targets are reached, XRP could experience one of its most significant rallies in recent history. Also Read: Top Investor Issues Advance Warning to XRP Holders – Beware of this Risk The post Egrag Crypto: XRP Could be Around $6 or $7 by Mid-November Based on this Analysis appeared first on 36Crypto.
Share
Coinstats2025/09/18 18:36
‘High Risk’ Projects Dominate Crypto Press Releases, Report Finds

‘High Risk’ Projects Dominate Crypto Press Releases, Report Finds

The post ‘High Risk’ Projects Dominate Crypto Press Releases, Report Finds appeared on BitcoinEthereumNews.com. More than six in 10 crypto press releases published
Share
BitcoinEthereumNews2026/02/04 13:09
Why Vitalik Says L2s Aren’t Ethereum Shards Now?

Why Vitalik Says L2s Aren’t Ethereum Shards Now?

The post Why Vitalik Says L2s Aren’t Ethereum Shards Now? appeared on BitcoinEthereumNews.com. Vitalik says Ethereum’s scaling and higher gas limits mean L2s no
Share
BitcoinEthereumNews2026/02/04 13:18