

Bitcoin Falls 26%, But Outperforms Every Major Crypto Sector in 3 Months — What’s Going On?

Bitcoin has fallen sharply from its recent peak, but fresh data shows it is still holding up better than almost every other corner of the crypto market, showing how capital behavior has shifted during the latest downturn.
Bitcoin is down roughly 26% over the past three months and about 30% from its all-time high near $126,200, trading just above the $85,000 level.
Despite the drop, on-chain analytics firm Glassnode said Bitcoin has outperformed nearly all major crypto sectors over the same period.
From AI to Meme Coins, Crypto Sectors Sink as Bitcoin Shows Relative Strength
The broader market context helps explain the divergence. Total crypto market capitalization fell around 27.5% over the past three months, slightly more than Bitcoin’s decline.
Ether has suffered a deeper drawdown, sliding about 36% since mid-September and trading below $3,000.
 Source: Coingecko
Other narrative-driven sectors have fared worse. AI-related tokens are down roughly 48%, meme coin market capitalization has dropped about 56%, and real-world asset tokenization tokens have fallen around 46%.
DeFi tokens have also struggled, declining close to 38% over the same period.
Glassnode’s cross-sector performance data shows how the sell-off unfolded. In late September, most sectors were clustered near neutral performance, suggesting capital was still broadly distributed and risk appetite remained intact.
That changed in early October, when a sharp, market-wide shock pushed nearly all sectors lower. High-beta areas such as Layer 1s, Layer 2s, AI, gaming, NFTs, and meme tokens saw deeper drawdowns, while Bitcoin fell more modestly, acting as a relative shelter.
 Source: Glassnode
Attempts at recovery in mid-October failed to gain traction. Small rebounds across altcoin sectors did not reclaim prior levels, and Glassnode data shows no sector returning to neutral performance.
By late October and into November, losses widened further, with performance dispersion increasing and capital continuing to withdraw rather than rotate.
By mid-November, several sectors entered what Glassnode described as a capitulation phase, with drawdowns deepening across Layer 1s, DePIN, gaming, NFTs, and memes. Bitcoin and Ether also fell, but Bitcoin maintained the shallowest relative losses.
Shark Accumulation Hits Fastest Pace Since 2012 as Whales Distribute
By December, the picture had become clearer. Bitcoin stood out as the top relative performer despite remaining in negative territory, while Ether continued to lag.
Defensive altcoin categories such as exchange tokens and staking-related assets sat in the middle, and speculative narratives occupied the bottom.
Source: Bitcoin vector
Glassnode said the data does not show rotation into new winners but rather graduated losses, with Bitcoin retaining capital more effectively as liquidity tightened.
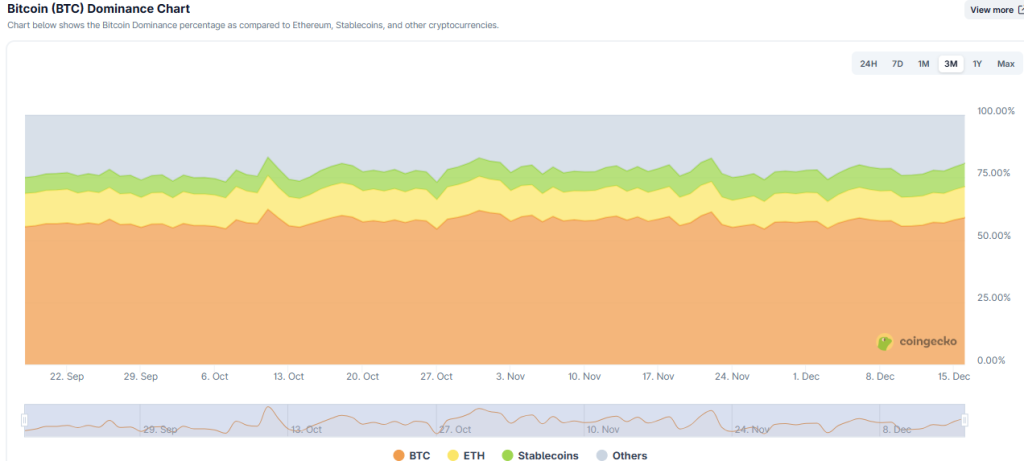
This relative strength has played out alongside shifting BTC dominance dynamics. Earlier in the year, Bitcoin dominance rose steadily and peaked near 65%, coinciding with a strong price rally.
The structure changed around mid-July, when dominance began to fall and capital rotated into altcoins.
That rotation broke down during an October deleveraging event, when forced liquidations briefly pushed capital back into Bitcoin.
Since then, dominance has moved sideways between roughly 59% and 61%, reflecting a market without a clear anchor.
Bitcoin’s relative outperformance shows that investors are still treating BTC as a defensive anchor, preserving capital during periods when altcoins face deeper drawdowns and weaker conviction.
Onchain positioning adds another layer to the story. Glassnode data shows that mid-sized holders, often referred to as “sharks” with balances between 100 and 1,000 BTC, added about 54,000 BTC over the past week, bringing their collective holdings to roughly 3.575 million BTC.
Source: Glassnode
The pace of accumulation is the fastest seen since 2012, suggesting strong dip-buying from higher-net-worth individuals and institutional players.
At the same time, selling pressure has come from long-term holders and so-called OG whales with balances above 10,000 BTC.
Source: Glassnode
According to Glassnode and Capriole Investments, distribution from older coins has offset record institutional buying, limiting near-term upside and keeping downside risks in focus.
You May Also Like

Securities Fraud Investigation Into Corcept Therapeutics Incorporated (CORT) Announced – Shareholders Who Lost Money Urged To Contact Glancy Prongay Wolke & Rotter LLP, a Leading Securities Fraud Law Firm

Microsoft Corp. $MSFT blue box area offers a buying opportunity
