PENDLE at $1: Can Bulls Clear the Next Key Barrier?
- PENDLE trades at $1, and the trading volume is up by 77%.
- The technical chart shows emerging signs of strength.
PENDLE’s four-hour chart reflects that the price is forming an ascending triangle, a pattern seen when buyers gradually push the price higher while resistance stays stable. The rising trendline under the price indicates that higher lows are forming. If it manages to break above the horizontal resistance level, it triggers a stronger upside move.
Moreover, based on the height of the pattern, analysts estimate a potential move of around 20%. The breakout needs confirmation with strong volume, as failed breakouts can also lead to short-term pullbacks.
 (Source: CMC)
Currently, PENDLE is up by over 5.07% and is trading within the $1.33 range. The trading volume has increased by over 77.50%, reaching the $28.85 million mark, as per CoinMarketCap.
The uptrend of PENDLE might push the price up toward the resistance at around $1.37. If the bullish pressure gains more traction, the golden cross could form and likely take the price above $1.41. Assuming the bears are in control of the PENDLE market, the price could fall to the support at $1.29. With the death cross unfolding, the downside correction would send the price below $1.25.
Early Signs of Upside Appear in PENDLE’s Technical Chart
PENDLE’s daily Relative Strength Index at 66.30 suggests its solid bullish momentum, with buyers in control. Also, it may approach the overbought level. The traders will start watching for signs of slowing momentum if the RSI continues to climb closer to 70.
The Bull Bear Power (BBP) of 0.084 indicates a mild bullish pressure. The price is slightly above its average level, and the strength of the move is modest. If the value rises, it builds more momentum, while a move back to zero weakens the buying pressure.
Besides, the Moving Average Convergence Divergence (MACD) line crosses above the signal line, showing a shift toward the bullish side. The recent price action of PENDLE is starting to strengthen. However, the strength depends on whether momentum continues to build after the crossover.
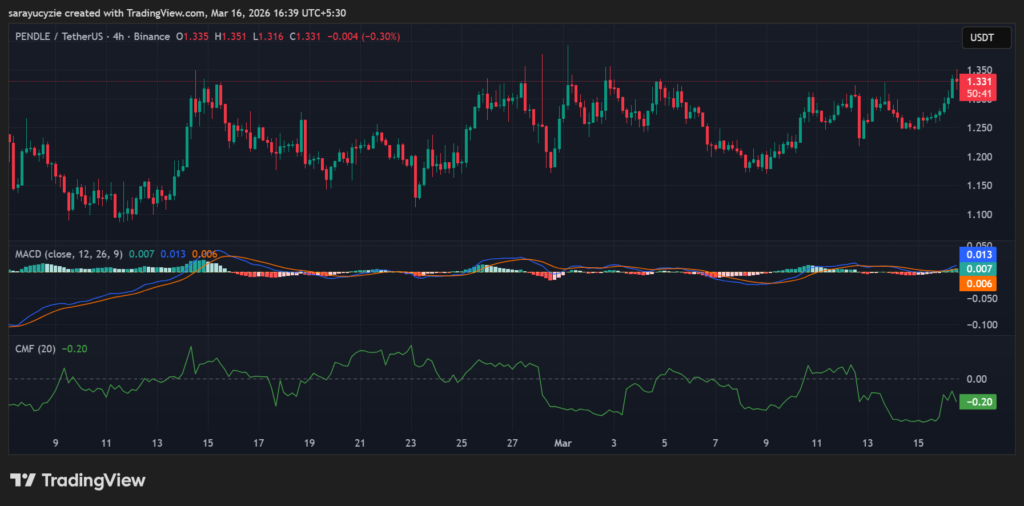 (Source: TradingView)
PENDLE’s Chaikin Money Flow indicator is located at -0.20 points to strong selling pressure. Notably, the capital is flowing out, and it reflects distribution and weakening demand. If the CMF remains this low, the price may face more downward pressure, unless buying interest starts to return.
Top Updated Crypto News
Solana (SOL) Gains Ground: Will the Momentum Trigger a $100 Breakout?
Potrebbe anche piacerti

T. Rowe Price Files Second Amendment for an Actively Managed Crypto ETF Covering Up to 15 Digital Assets

Zcash Surges 23% as Privacy Coins See Renewed Market Interest in March 2026