Peter Schiff has warned of a “crypto ice age” as Bitcoin and the broader crypto market slide, while calling Michael Saylor’s BTC treasury strategy ‘’harebrained.’’ [...]Peter Schiff has warned of a “crypto ice age” as Bitcoin and the broader crypto market slide, while calling Michael Saylor’s BTC treasury strategy ‘’harebrained.’’ [...]

Hyperliquid Price Prediction: HYPE Slips 1% Even As Bitwise Files For Spot HYPE ETF

2025/09/26 16:51
3 min read
For feedback or concerns regarding this content, please contact us at crypto.news@mexc.com

The Hyperliquid price has tumbled almost 2% in the last 24 hours to trade at $42.26 as of 12.30 a.m. EST even as fund manager Bitwise filed for a Hyperliquid ETF.

The news of Bitwise’s HYPE ETF filing initially brought a short boost for the token, with the price popping about 4% to $42.50 before paring gains

The ETF is designed to provide investors with direct exposure to HYPE through regulated brokerage accounts, with Coinbase Custody serving as the custodian. 


The ETF does not qualify for fast-track SEC approval because there are currently no regulated HYPE futures contracts. This means the process to get the ETF live might take months.

HYPE Price Tests Key $42 Support As Bulls Eye Rebound

On the daily chart, HYPE has been falling sharply from the recent high near $56, losing momentum as it crashed below its 50-day simple moving average (SMA) at $47.55. This moving average now acts as resistance and needs to be reclaimed for the bulls to gain back control.

The 200-day SMA is at $33.68, providing deeper long-term support if sellers continue to push.

Fibonacci retracement levels are in play: the coin is currently holding the 38.2% retracement level at $42.03. Below this, the next support stands around $37.72, the 50% retracement, and $33.41 at the 61.8% Fibonacci. 

The $42 level is especially important. If it holds, analysts like Ali Charts see a potential springboard for a rebound to $55 or higher. But if it breaks, price could head towards $38 or lower.

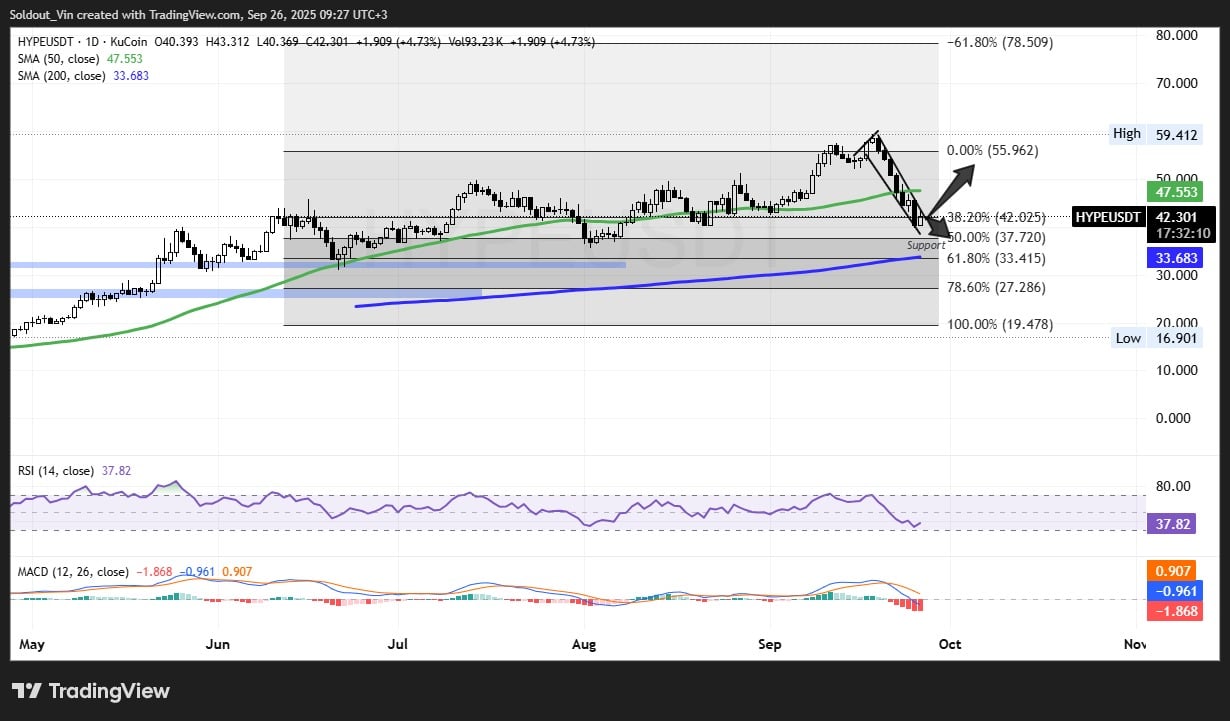
HYPEUSDT Analysis Source: Tradingview

The RSI (Relative Strength Index) shows a reading near 38, which is close to “oversold” levels. This might suggest a bounce is possible soon if buyers return. The MACD indicator, on the other hand, remains bearish as the signal line is still negative, showing sellers have control for now.

Analysts remain split about near-term HYPE price direction. Some say that if the ETF news and treasury buy-ins can bring fresh hype, the price could quickly try to reclaim the $47.55 level and then move towards $50 and $55 resistance zones. 

However, overall market sentiment is cautious, and most agree that a break below $42 would likely trigger a move to $38 or even the $33 range, where the 200-day moving average comes in as support.

Hyperliquid On-chain Analysis

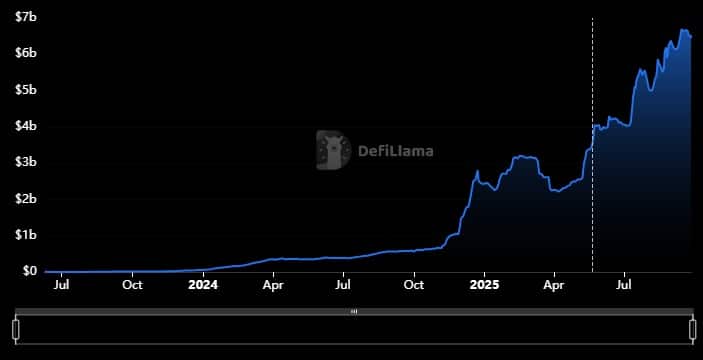
On-chain data shows that Hyperliquid continues to grow its decentralised finance ecosystem steadily. Total Value Locked (TVL) has reached over $5 billion, up from $3.5 billion at mid-year, reflecting a 70% rise in user funds locked into the protocol since January 2025. 

Weekly inflows average $58 million, signalling consistent investor interest despite challenging market conditions.

Whale activity has been notable lately, with large purchases of HYPE tokens, including a recent $10 million buy by a single whale, shifting capital from vaults to spot accounts, demonstrating strong confidence from big holders. 

Additionally, technical upgrades such as the upcoming HIP-3 market creation feature aim to decentralise the protocol further and draw in more community involvement. These on-chain metrics support a cautiously optimistic view of HYPE’s long-term fundamentals even as the price struggles mid-term

Big buys from institutional players like Hyperion DeFi, recently adding $10 million worth of HYPE to its treasury, are helping maintain confidence and provide a backstop on big price drops.

Related Articles:

Market Opportunity
Hyperliquid Logo
Hyperliquid Price(HYPE)
$37.16
$37.16$37.16
-0.45%
USD
Hyperliquid (HYPE) Live Price Chart
Disclaimer: The articles reposted on this site are sourced from public platforms and are provided for informational purposes only. They do not necessarily reflect the views of MEXC. All rights remain with the original authors. If you believe any content infringes on third-party rights, please contact crypto.news@mexc.com for removal. MEXC makes no guarantees regarding the accuracy, completeness, or timeliness of the content and is not responsible for any actions taken based on the information provided. The content does not constitute financial, legal, or other professional advice, nor should it be considered a recommendation or endorsement by MEXC.

You May Also Like

4 Web3 Games That Will Be on Serious Rotation This Fall

4 Web3 Games That Will Be on Serious Rotation This Fall

Pudgy Party, Pixels, EVE Frontier, and The Beacon headline fall’s web3 gaming season with strong communities, token rewards, and polished gameplay that keeps players engaged.
Share
Blockchainreporter2025/09/18 22:08
Crypto Investors Who Made Millions WithShiba Inu, Are Now Rotating To Pepeto

Crypto Investors Who Made Millions WithShiba Inu, Are Now Rotating To Pepeto

It now sits above $115,000, a reminder that life-changing runs usually start before the crowd shows up. So the question […] The post Crypto Investors Who Made Millions WithShiba Inu, Are Now Rotating To Pepeto appeared first on Coindoo.
Share
Coindoo2025/09/18 22:39
BTC Leverage Builds Near $120K, Big Test Ahead

BTC Leverage Builds Near $120K, Big Test Ahead

The post BTC Leverage Builds Near $120K, Big Test Ahead appeared on BitcoinEthereumNews.com. Key Insights: Heavy leverage builds at $118K–$120K, turning the zone into Bitcoin’s next critical resistance test. Rejection from point of interest with delta divergences suggests cooling momentum after the recent FOMC-driven spike. Support levels at $114K–$115K may attract buyers if BTC fails to break above $120K. BTC Leverage Builds Near $120K, Big Test Ahead Bitcoin was trading around $117,099, with daily volume close to $59.1 billion. The price has seen a marginal 0.01% gain over the past 24 hours and a 2% rise in the past week. Data shared by Killa points to heavy leverage building between $118,000 and $120,000. Heatmap charts back this up, showing dense liquidity bands in that zone. Such clusters of orders often act as magnets for price action, as markets tend to move where liquidity is stacked. Price Action Around the POI Analysis from JoelXBT highlights how Bitcoin tapped into a key point of interest (POI) during the recent FOMC-driven spike. This move coincided with what was called the “zone of max delta pain”, a level where aggressive volume left imbalances in order flow. Source: JoelXBT /X Following the test of this area, BTC faced rejection and began to pull back. Delta indicators revealed extended divergences, with price rising while buyer strength weakened. That mismatch suggests demand failed to keep up with the pace of the rally, leaving room for short-term cooling. Resistance and Support Levels The $118K–$120K range now stands as a major resistance band. A clean move through $120K could force leveraged shorts to cover, potentially driving further upside. On the downside, smaller liquidity clusters are visible near $114K–$115K. If rejection holds at the top, these levels are likely to act as the first supports where buyers may attempt to step in. Market Outlook Bitcoin’s next decisive move will likely form around the…
Share
BitcoinEthereumNews2025/09/18 16:40