

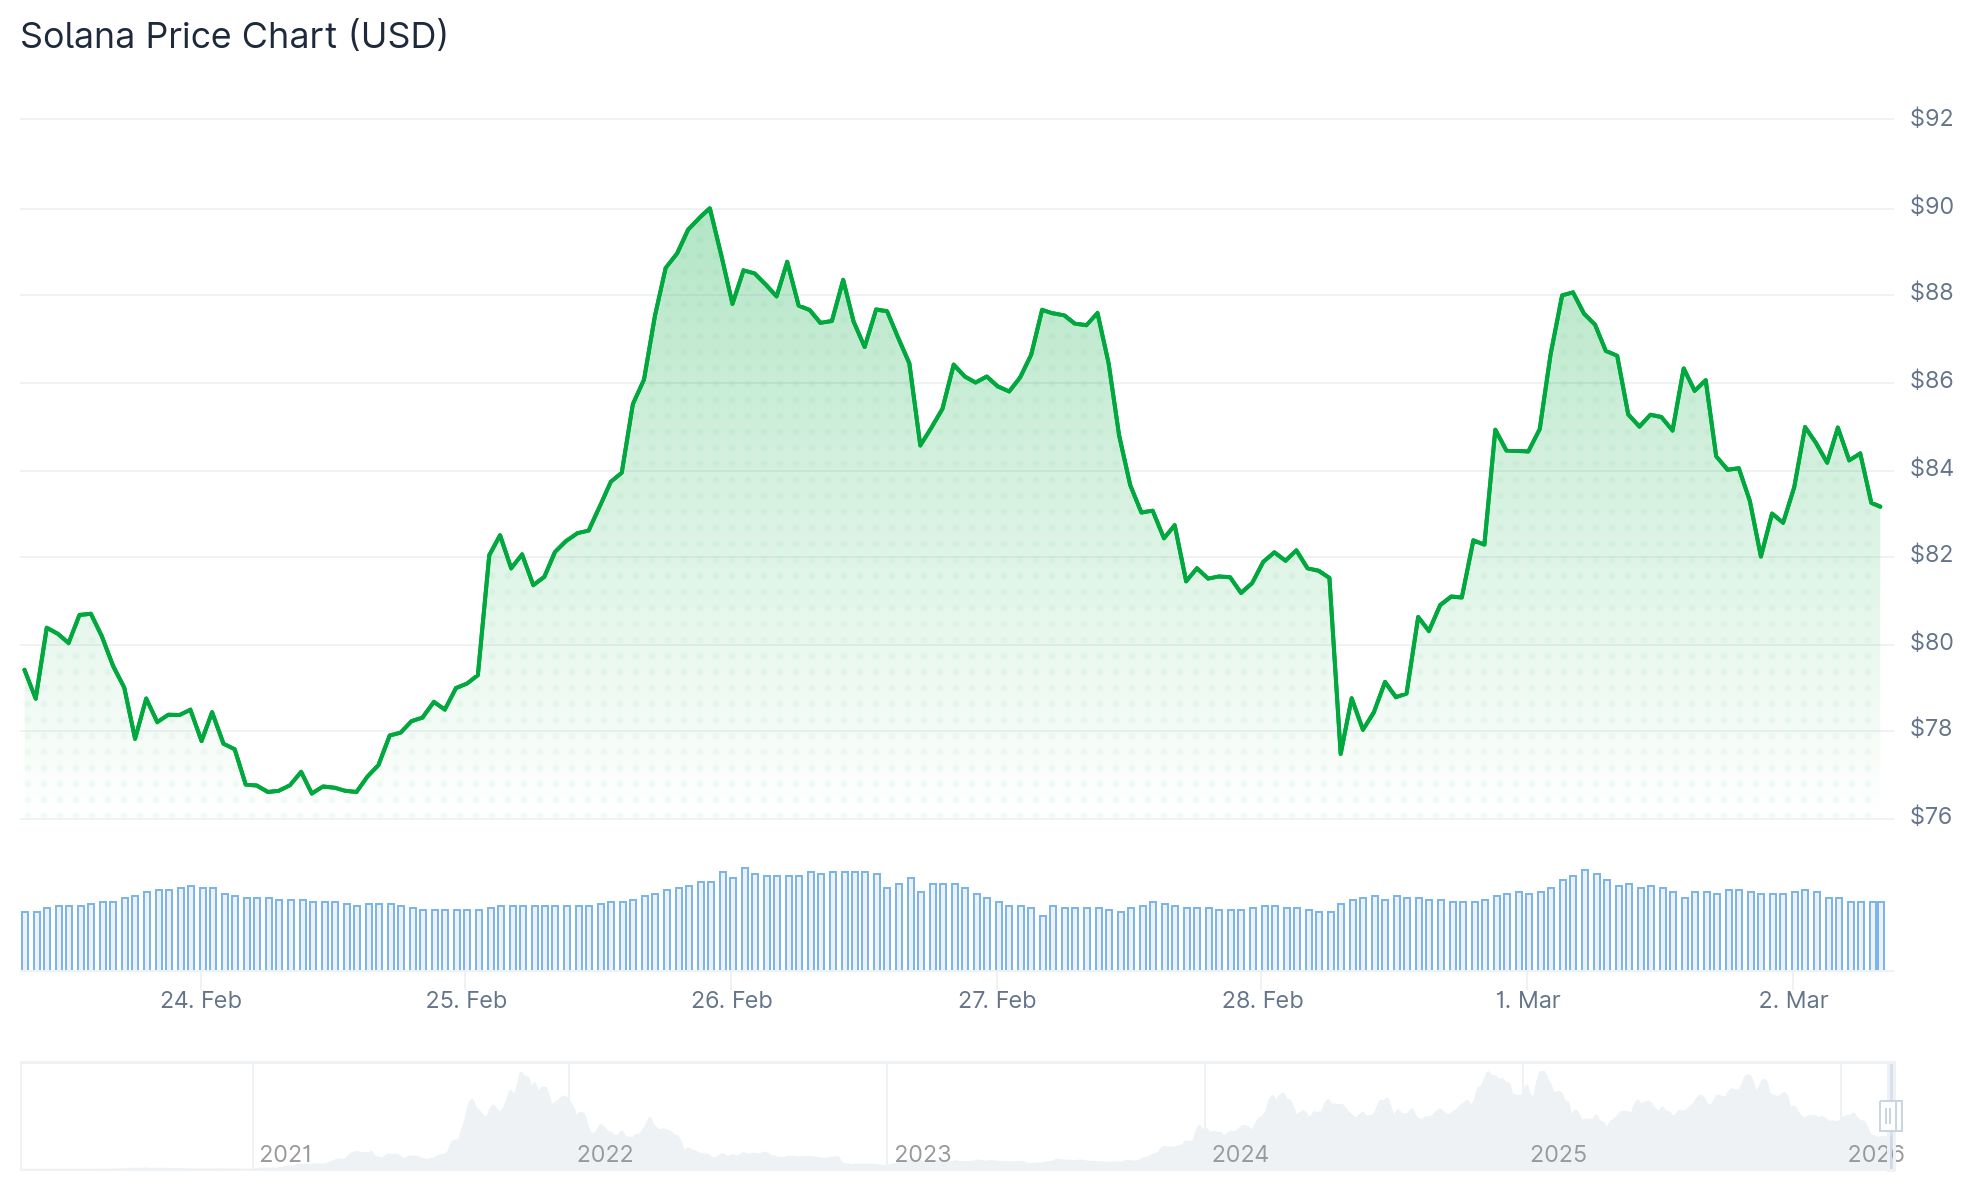
Solana (SOL) Consolidates Near $85: Will the Four-Week Range Finally Break?
TLDR
- Solana (SOL) remains confined within a $77–$88 corridor for approximately four weeks without establishing a clear directional bias
- Spot Solana ETFs in the United States attracted more than $44 million in weekly capital, pushing total inflows beyond $900 million
- Open Interest in SOL futures contracts declined by over 6% within a 24-hour span, accompanied by $26.47 million in forced liquidations predominantly affecting long traders
- A Bollinger Band squeeze formation suggests imminent volatility expansion, though the breakout direction remains uncertain
- New Solana wallet addresses increased by 1.4 million across a 12-day period, climbing to 8.6 million and indicating expanding network adoption
As of March 2, 2026, Solana (SOL) continues to hover around the $84–$85 mark, locked within a consolidation pattern that has persisted for nearly a full month. The cryptocurrency has repeatedly tested the boundaries between $77 and $88 without managing a convincing breakout in either direction.
 Solana (SOL) Price
While price action remains muted, institutional appetite has demonstrated remarkable persistence. Last week, US-based spot Solana ETFs attracted $44.44 million in fresh capital, with a notable single-day surge of $30.86 million recorded on Wednesday.
Year-to-date cumulative flows into these ETF products have now crossed the $900 million threshold. Throughout February, Solana ETFs maintained a streak of over 12 consecutive days with positive net flows, a period during which both Bitcoin and Ethereum ETF products experienced capital withdrawals.
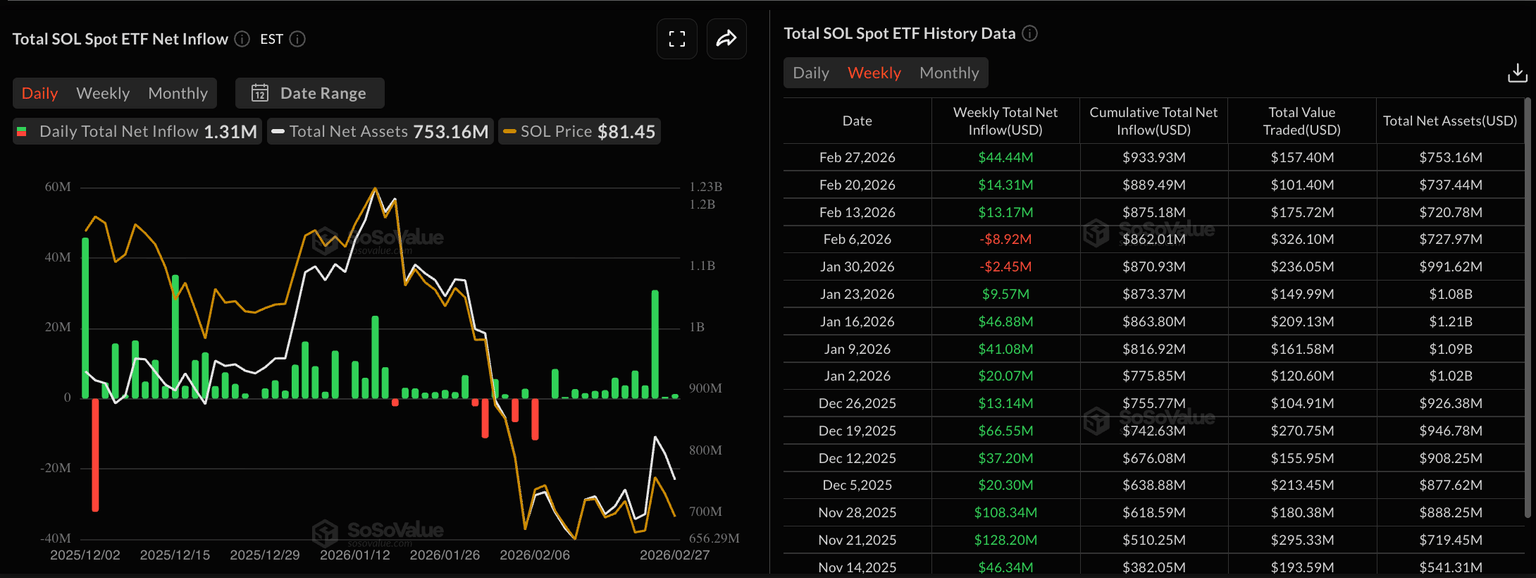 Source: SoSoValue
Retail trader behavior paints a contrasting picture. Open Interest across SOL futures markets contracted by more than 6% within a 24-hour timeframe, dropping to $4.89 billion as participants unwound their positions.
Forced liquidations totaled $26.47 million during this period, with long position liquidations accounting for $20.47 million of that figure. This substantial washout eliminated numerous bullish speculative bets.
Despite these liquidation events, the funding rate remains in the 0.0037–0.0041% range, indicating that leveraged long traders continue paying a modest premium to maintain their positions.
Key Technical Levels
SOL continues trading beneath both its 50-day and 200-day Exponential Moving Averages, positioned at $99.06 and $137.23 respectively. These moving averages currently function as significant resistance barriers.
The Relative Strength Index registers around 43, positioned below the neutral threshold of 50. Meanwhile, the MACD histogram reflects diminishing bearish pressure without yet signaling a bullish reversal through a crossover.
Bollinger Bands display notable convergence on the daily timeframe. Such compression patterns typically precede substantial price movements, although the eventual direction cannot be predetermined from the squeeze alone.
Crypto analyst Umair highlighted a divergence between SOL’s performance against USDT versus BTC. While the USDT pairing displays a pattern of declining highs, the BTC pair exhibits ascending highs — a technical split that has persisted for 24 days.
On-Chain Data Shows Network Growth
Blockchain analytics from Glassnode reveal that daily new Solana addresses expanded by 1.4 million throughout the preceding 12-day interval, bringing the cumulative total to 8.6 million. This metric points to accelerating user adoption across the ecosystem.
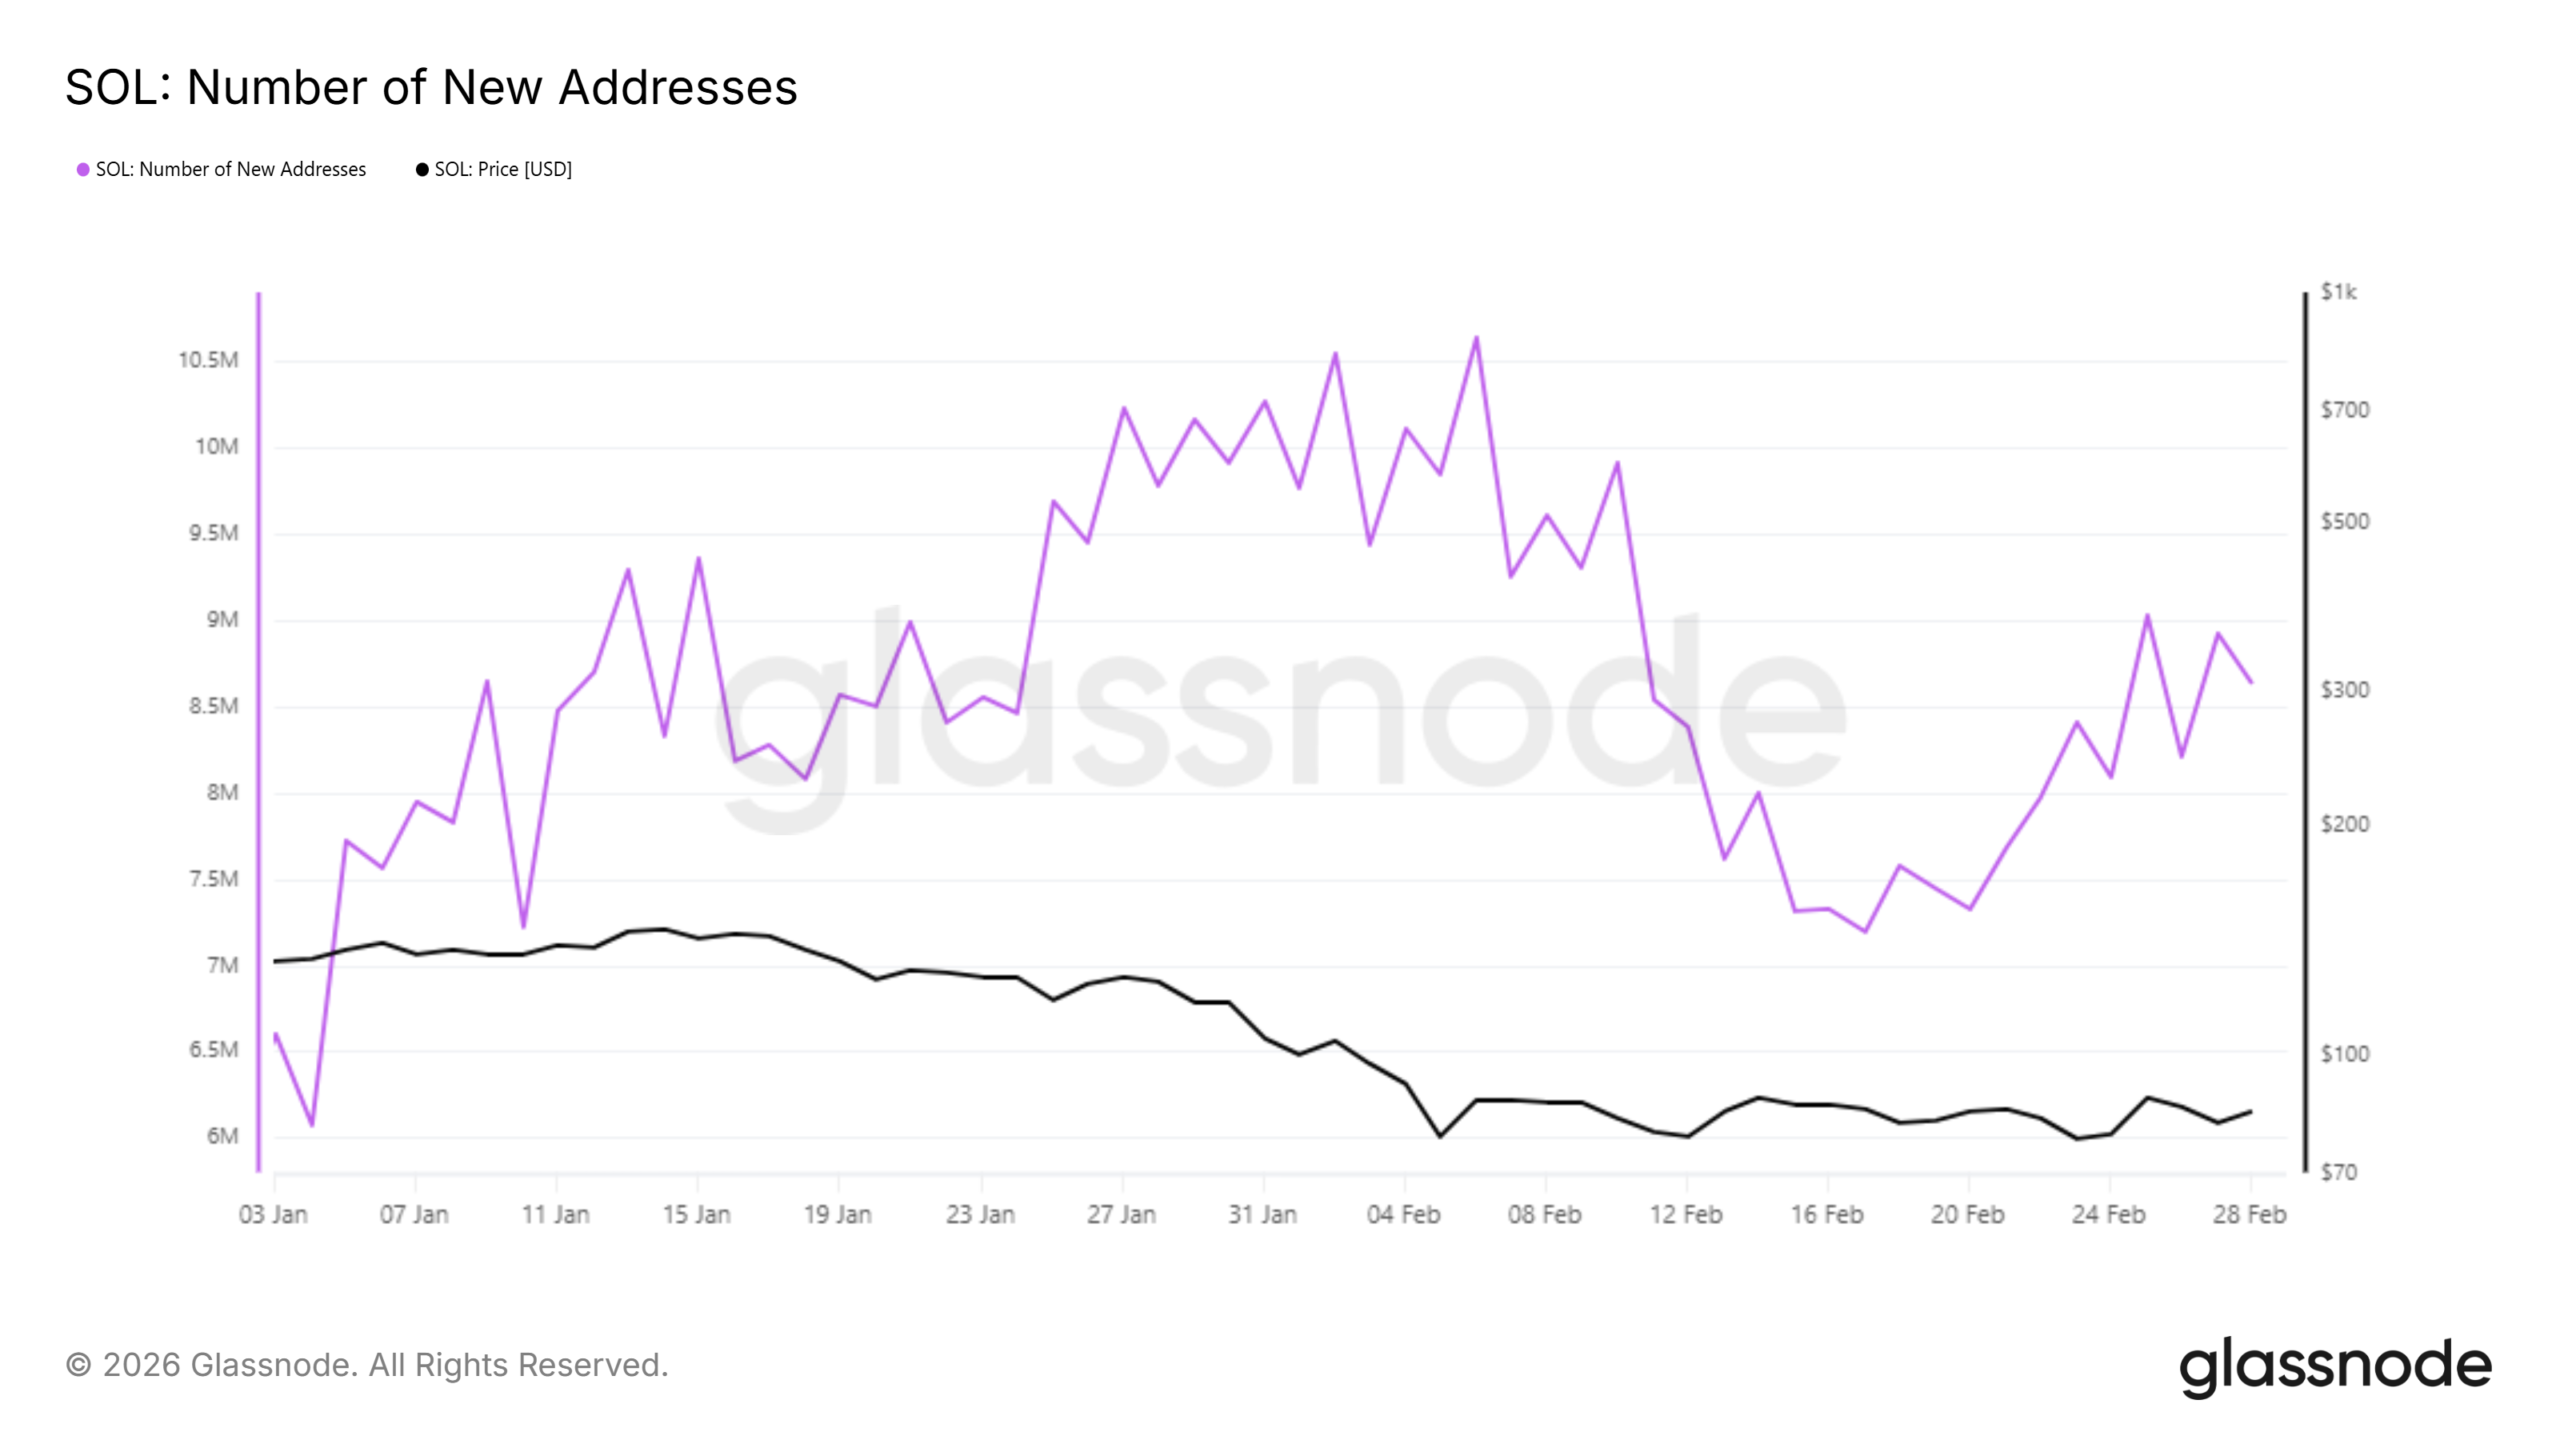 Source: Glassnode
Long-term token holders maintain profitability in aggregate, although accumulation velocity has decelerated. Hodler net position metrics demonstrate sustained conviction but reflect diminished buying intensity.
Should SOL successfully breach $88 followed by $93.43, the subsequent upside target becomes the 50-day EMA vicinity around $99. Securing a daily close above that level would establish a pathway toward the $137 region.
Conversely, if price action penetrates below $77, the next meaningful support zone emerges at $67.50, corresponding to the February 6 local bottom.
SOL’s 24-hour trading volume decreased by 5.77% to $12.20 billion, while Open Interest similarly contracted by 3.73% to $4.88 billion according to the most recent market data.
The post Solana (SOL) Consolidates Near $85: Will the Four-Week Range Finally Break? appeared first on Blockonomi.
You May Also Like

Xiaomi Stock: Flagship Phones Launch as Memory Prices Surge 80–90%

EUR/CHF slides as Euro struggles post-inflation data
![[Rappler’s Best] ‘Locked, loaded, and ready to go’](https://www.rappler.com/tachyon/2026/03/Screenshot-2026-03-02-at-3.24.58-PM.png?resize=75%2C75&crop_strategy=attention)