

Why Is Internet Computer Price Pumping? ICP Outlook For The Next 12 Months
Internet Computer price jumped sharply on March 11 after a major exchange listing opened the door to one of Asia’s most active crypto markets. The move came soon after trading began for ICP on a large South Korean exchange, and the market reacted almost immediately.
Internet Computer price climbed as much as 16% during the session. Trading volume expanded dramatically at the same time, which shows that liquidity arrived quickly once the listing went live. Many market participants had anticipated the event ahead of time, yet the scale of the reaction still caught attention across derivatives and spot markets.
That sudden ICP price rally now raises an obvious question. Does this move mark the start of a stronger recovery for Internet Computer, or does it simply represent a short-term reaction to a new listing event?
Another element deserves attention here. Internet Computer already sits inside several emerging narratives connected to decentralized infrastructure and artificial intelligence services. Interest around on chain AI systems has grown in recent months, and Internet Computer markets itself as a platform that can support those applications directly on-chain.
Developments inside the broader technology sector also helped the narrative. Several large companies have been preparing new AI agent systems and autonomous platforms. Many investors now examine which blockchain infrastructure could host these services in the future. Internet Computer frequently appears in those conversations because of its architecture and compute-focused design.
Leveraged Trading Activity Amplified The Internet Computer Price Breakout
Spot demand from the exchange listing did not act alone. Derivatives markets quickly joined the move and amplified the rally.
Open interest across ICP derivatives markets expanded by roughly 44% during the price advance. Such increases usually appear when traders open new leveraged positions in anticipation of continued movement.
Technical signals also turned constructive during the move. Internet Computer price pushed above its 7 day and 30 day moving averages. Short term trend indicators therefore flipped into positive territory after several weeks of sideways action.
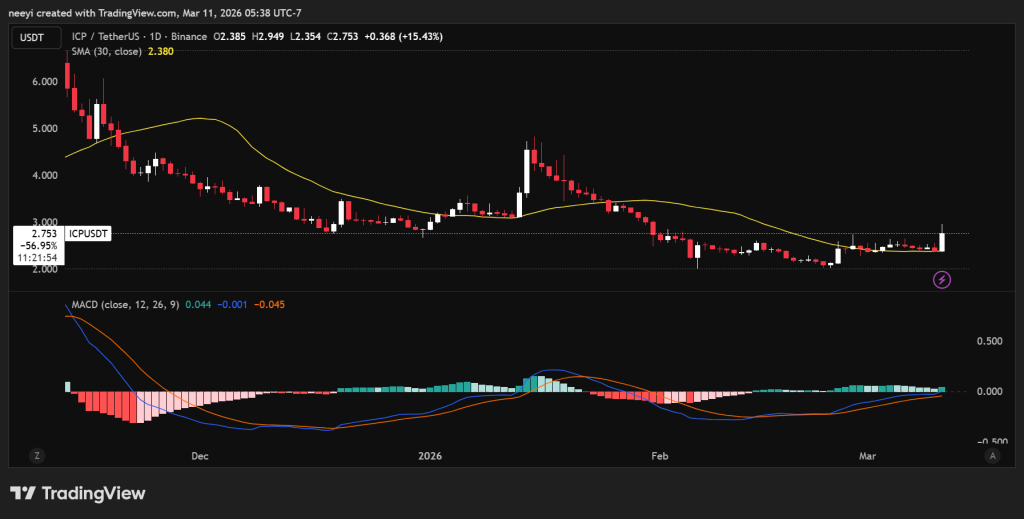 ICP Price Chart Showing 30-Day and MACD / Source: TradingView
Momentum indicators showed early improvement as well. The MACD histogram moved into positive territory after a long period of weakness. This signal often appears during the early phase of a possible trend reversal.
These factors created a feedback loop. Spot demand pushed ICP price upward. Leveraged traders noticed the move and opened positions that reinforced the upward momentum.
Such setups can accelerate rallies quickly. They can also produce sharp pullbacks if leveraged traders begin closing positions.
Current technical indicators show improvement for Internet Computer price. The broader trend still remains under pressure despite the recent bounce.
| Metric | Value | Interpretation |
|---|---|---|
| Price | $2.74 | Current spot level |
| 7 day SMA | $2.46 | Very short term average |
| 30 day SMA | $2.37 | Medium term trend just below price |
| 200 day SMA | $3.74 | Long term trend well above price |
| RSI 14 | 45.38 | Neutral slightly below center |
| 7d / 30d change | +7.92% / +15.16% | Ongoing rebound |
| 1y change | -48.2% | Long term holders remain under water |
Internet Computer price now trades above both its 7 day and 30 day moving averages. Markets often interpret that structure as a short term uptrend or recovery bounce.
The larger trend still needs repair. ICP price remains about 27% below its 200 day moving average near $3.74. That level frequently acts as a major technical barrier during long recoveries.
Momentum indicators show a mixed picture. RSI sits near 45. That value indicates neither strong buying pressure nor strong selling pressure. Markets often show similar readings during early recovery phases.
MACD indicators still carry traces of the previous downtrend. The MACD line remains below zero even though the histogram moved into positive territory. This setup usually appears when momentum begins to improve but the long term trend has not fully reversed.
Read Also: How Much Could $100 in Hedera (HBAR) Be Worth in 2026?
Internet Computer Price Outlook For The Next 12 Months Depends On One Key Technical Barrier
The next major test for Internet Computer price sits near the 200 day moving average around $3.7. Markets often view this level as a dividing line between bearish trends and recovery phases.
A constructive scenario would require ICP price to move above that region and hold it on strong trading volume. Markets would likely interpret such a move as evidence that the long downtrend has ended.
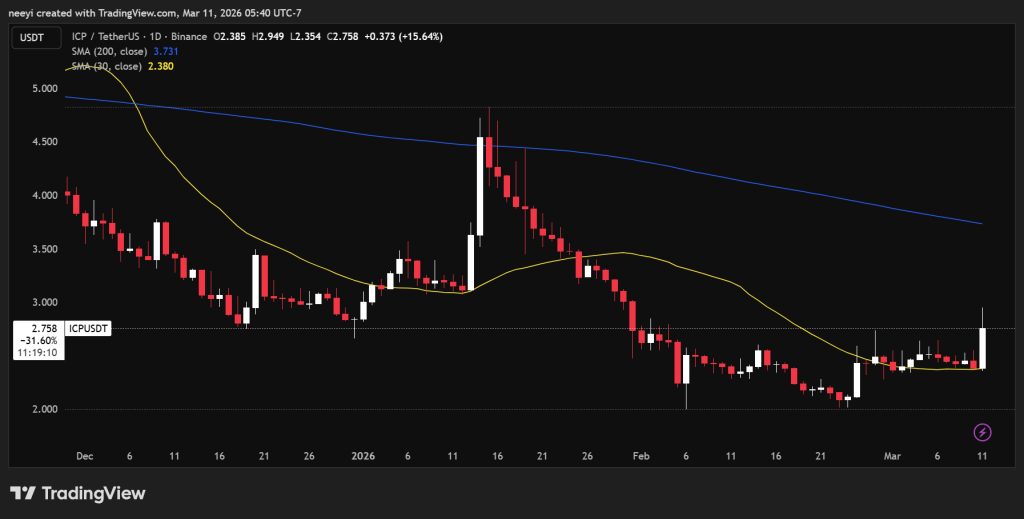 ICP Price Chart Showing 30-Day and 200-Day SMA / Source: TradingView
Momentum indicators would need to confirm the move as well. RSI holding above 60 during rallies would show persistent demand. MACD moving above zero would reinforce the idea that a larger uptrend has begun.
Network activity also matters in that scenario. Growth in developers, applications, and on chain activity would strengthen confidence in the Internet Computer ecosystem.
Read Also: What’s Really Fueling Gold and Silver Rally? (Hint: It’s Not Just the War)
A weaker path remains possible as well. ICP price could rally toward the 200 day moving average and fail to hold above it. Repeated rejection near that zone often produces lower highs and renewed selling pressure.
Short term support levels then become important. Internet Computer price would need to defend the region around its 30 day moving average near $2.37. Loss of that level could send price back into the lower portion of its multi month range.
Subscribe to our YouTube channel for daily crypto updates, market insights, and expert analysis.
The post Why Is Internet Computer Price Pumping? ICP Outlook For The Next 12 Months appeared first on CaptainAltcoin.
You May Also Like

Solana Overtakes Ethereum In Trillion-Dollar Sector, Is There A New King In Town?

Shiba Inu Price Steady as Kusama’s X Silence Sparks Speculation
